Friday, December 23, 2005

WOAH SOLVDD, the Brewerfan.net Radio Show

This was from a few weeks ago:

WOAH SOLVDD, the
Brewerfan.net radio show is launched!


Brewerfan.net is pleased to
announce that the first edition of our radio show, WOAH SOLVDD, is complete and
available for download:

http://www.woah-solvdd.pawlowski.ws/audio/December_2005_Woah_Solvdd.mp3

Size: 12:MB Format: MP3 Duration: 25 minutes

Included are
interviews with site creator Brian Kapellusch, Geno Selig-Prieb and his "Skeptic
Tank", and rluzinski does some SABR Rattling with his stat of the month.

Much thanks go out to Iron Chef Napalm for making this entire thing
happen. We hope you enjoy our initial installment of this new addition to our
site.


I thought it turned out great and look forward to contributing to the next installment.

Run Support Sure Helps

I thought it would be fun to look at the qualifying pitchers with the best run support in 2005. Here are the top 20:

TM RS Record ERA

David Wells Bos 7.97 15 - 7 4.45
Chris Young Tex 7.32 12 - 7 4.26
Matt Clement Bos 6.88 13 - 6 4.57
Cliff Lee Cle 6.46 18 - 5 3.79
Jeff Francis Col 6.37 14 - 12 5.68
Matt Morris StL 6.26 14 - 10 4.11
Gustavo Chacin Tor 6.21 13 - 9 3.72
Kenny Rogers Tex 6.17 14 - 8 3.46
Bartolo Colon LAA 6.02 21 - 8 3.48
Freddy Garcia CWS 5.96 14 - 8 3.87
M. Hendrickson TB 5.96 11 - 8 5.90
Danny Haren Oak 5.93 14 - 12 3.73
Mike Mussina NYY 5.91 13 - 8 4.41
Josh Beckett Fla 5.89 15 - 8 3.38
J. Bonderman Det 5.67 14 - 13 4.57
C.C. Sabathia Cle 5.63 15 - 10 4.03
Jamie Moyer Sea 5.63 13 - 7 4.20
Randy Johnson NYY 5.62 17 - 8 3.79
B. Claussen Cin 5.62 10 - 11 4.21
Kris Benson NYM 5.58 10 - 8 4.13

The relationship between run support and win/loss record is quite evident by this list. That or Francis and Hendrickson are just "winners"?

Let's look at the bottom of this list:

TM RS Record ERA

Kip Wells Pit 3.07 8 - 18 5.09
Mark Redman Pit 3.23 5 - 15 4.90
Ryan Franklin Sea 3.30 8 - 15 5.10
Zack Greinke KC 3.39 5 - 17 5.80
Javier Vazquez Ari 3.51 11 - 15 4.42
Roger Clemens Hou 3.58 13 - 8 1.87
Nate Robertson Det 3.66 7 - 16 4.48
Kyle Lohse Min 3.68 9 - 13 4.18
Brian Lawrence SD 3.68 7 - 15 4.83
Josh Fogg Pit 3.77 6 - 11 5.05
Jarrod Washburn LAA 3.81 8 - 8 3.20
John Patterson Was 3.86 9 - 7 3.13
Esteban Loaiza Was 3.90 12 - 10 3.77
Joe Blanton Oak 3.93 12 - 12 3.53
Kevin Millwood Cle 3.98 9 - 11 2.86
Mark Buehrle CWS 4.15 16 - 8 3.12
Brett Tomko SF 4.20 8 - 15 4.48
Livan Hernandez Was 4.24 15 - 10 3.98
Brandon Webb Ari 4.24 14 - 12 3.50
Carlos Silva Min 4.25 9 - 8 3.44

There are some really nice pitchers on that list. How many wins would Clemens have had on the Yankees? How bad was it to be a starting pitcher for the Pirates last year?

Finally, the Brewer pitchers, with their ranks (if they qualified):

RNK RS Record ERA

-- Gary Glover 7.79 5 - 4 5.57
27 Chris Capuano 5.47 18 - 12 3.99
28 Tomo Ohka 5.44 7 - 6 4.35
65 Doug Davis 4.57 11 - 11 3.84
-- Ben Sheets Mil 3.73 10 - 9 3.33

One of these years, the Brewers are going to score some runs for Ben Sheets.

Wednesday, December 21, 2005

Sacrifice Attempts / Successes

Dan Fox wrote an article over at Hardball Times about sacrifices. In the article he included sacrifice attempts and successes for every MLB team in 2005. This subject interested me for two reasons:

1. I generally hate sacrifices and felt Yost called too many of them in 2005. I suspected the Brewers attempted an above average number of them but had no data to back up that suspicion. Did they?

2. Anytime the Brewers failed at sacrificing in 2005, many at brewerfan.net took the opportunity to point out how bad the Crew was at sacrificing. While there were indeed a good amount of horribly botched sacrifice attempts in 2005, I was skepticle that they were significantly worse at sacrificing than an average team. Were they?

Dan's Fox's data answered both of these questions:

Team Att Suc SuccR

WAS 132 96 72.7%
COL 126 95 75.4%
FLO 125 95 76.0%
SFN 118 95 80.5%
HOU 113 92 81.4%
SLN 112 85 75.9%
ATL 108 81 75.0%
MIL 108 80 74.1%
ARI 101 75 74.3%
SDN 101 73 72.3%
CHN 98 71 72.4%
NYN 96 71 74.0%
PHI 93 70 75.3%
PIT 90 63 70.0%
LAN 86 62 72.1%
CIN 80 61 76.3%
CHA 74 50 67.6%
SEA 61 50 82.0%
KCA 60 50 83.3%
ANA 60 49 81.7%
MIN 60 47 78.3%
DET 57 46 80.7%
BAL 54 44 81.5%
CLE 54 44 81.5%
TBA 51 41 80.4%
NYA 44 35 79.5%
TOR 30 23 76.7%
OAK 30 23 76.7%
BOS 22 18 81.8%
TEX 11 9 81.8%
---------------------
AVE: 78.5 -- 77.0%

While it initially appears that the Brewers attempted an above average amount of sacrifices, that's simply because the NL attempts many more as a whole. The NL average was about 105, making the Crew average as well.

On a side note, Frank Robinson sure likes to sacrifice alot!

As for the success rate, the Crew's rate was pretty close to average. In fact, if they had converted only 3 more sacrifices successfully, they would have been exactly average. I think this is just another example of fans placing too much importance on failure, which distorts their perception of events. I'm sure you'd find fans from every team that thinks their team fails too often at sacrifices.

For completeness, here's the same data in graphical form:
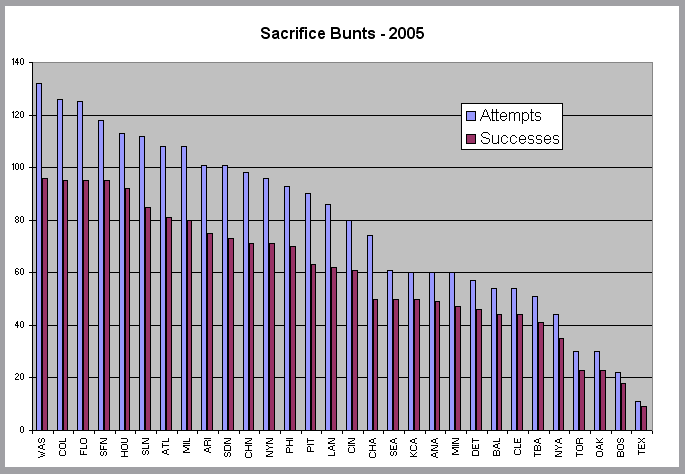
Sacrifice Attempts and Successes

Cubs Sign Jacque Jones

The Cubs signed Jacque Jones to a reported 3 year, $16 mil deal. Jones has been aweful against lefties in his career, compiling a .616 OPS against them in 779 career AB.

What if Dusty platooned Jones, though?

AB AVE OBP SLG OPS
Jones vs RHP(02-05) 1510 .277 .337 .472 .809
MLB AVE LF/RF(05) -- .272 .340 .451 .790

So, as long as Baker never let's Jones see a LHP again, he just got player that has a little more pop than the average corner OFer. Of course, Baker isn't going to platoon him, so they got a below average offensive corner OFer for a little over $5 mil a year. He'd have to have some pretty good defense to justify that.

Jenkins' contract looks better and better.

Tuesday, December 20, 2005

NFL Draft Order Prediction - Part 2

I thought I'd play around with scenarios that would give the Packers the best draft posiition. Getting the second overall pick isn't too far fetched. The three most important games:

WEEK 16:
Houston (@ home) beats Jacksonville

WEEK 17:
Houston (on road) beats San Fran
Jets (@ home) beat Buffalo

That ends up with:

# Tm Record SOS
1 SF 2 - 14 0.543
2 GB 3 - 13 0.547
3 ARI 4 - 12 0.504
4 DET 4 - 12 0.512

I like the Texans alot more than most, so I don't think the above scenario is too far fetched. If Houston beats Jacksonville this Sunday, I'd start to get excited. The big question is, would San Fran take Bush automatically? I don't follow those things close enough to have an opinion.

What's the most likely scenario where the Packers get the #1 overall pick? There's no easy one. Houston and San Fran would have to both win this Sunday. Then Houston would have to beat San Fran Week 17. Finally, Green Bay would have to finish with a lower SOS than Fran. Arizona beating Philli and and Baltimore beating the Vikings week 16 would make their SOS's tied. Throw in a win by the Bucs over Atlanta this Sunday and the Packers get the #1 pick outright!

Like I said, not very likely. The link to the spreadsheet is below.

DraftOrder.xls

Russell Branyan Signed


That was a close one! Reports are that Branyan has signed a 1 year deal for $800,000. He still may be traded this off season (bullpen lefty is the best guess), but Melvin probably wouldn't trade him for nothing. I would guess that he'd rather not have Cirillo as the ONLY other option at 3B.

I'd like to see Hall get maybe 30-35 starts between SS and 2B, just so he can still be looked at as a middle infielder in a potential trade down the line. He'd have alot more value there. Cirillo and Branyan can fill in at 3B when Hall is playing elsewhere.

EDIT: Found out that Branyan's contract is non-guaranteed, so it's hard to imagine that there's much if any interest in him league wide. Wouldn't he have opted to become a free agent and test the market otherwise?

Monday, December 19, 2005

NFL Draft Order Prediction

With all the talk of the Packers getting a favorible pick in the upcoming NFL draft, I thought it would be fun to try and project where they might end up picking. Here's my best guess:

# Team Record Win % SOS

1 SF 2 - 14 0.125 0.549
2 NYJ 3 - 13 0.188 0.525
3 HOU 3 - 13 0.188 0.531
4 GB 3 - 13 0.188 0.541
5 ARI 4 - 12 0.250 0.506
6 TEN 4 - 12 0.250 0.509
7 DET 4 - 12 0.250 0.516
8 NO 4 - 12 0.250 0.521
9 OAK 4 - 12 0.250 0.532
10 BUF 5 - 11 0.313 0.504
11 BAL 5 - 11 0.313 0.525
12 STL 6 - 10 0.375 0.480
13 CLE 6 - 10 0.375 0.513
14 PHI 7 - 9 0.438 0.531
15 MIA 8 - 8 0.500 0.460
16 KC 8 - 8 0.500 0.523
17 MIN 9 - 7 0.563 0.491
18 ATL 9 - 7 0.563 0.495
19 DAL 9 - 7 0.563 0.525
20 TB 10 - 6 0.625 0.450
21 WAS 10 - 6 0.625 0.544
22 NYG 11 - 5 0.688 0.492
23 NE 11 - 5 0.688 0.498
24 PIT 11 - 5 0.688 0.506
25 SD 11 - 5 0.688 0.543
26 CHI 12 - 4 0.750 0.444
27 CAR 12 - 4 0.750 0.447
28 JAX 12 - 4 0.750 0.467
29 DEN 12 - 4 0.750 0.499
30 SEA 13 - 3 0.813 0.419
31 CIN 13 - 3 0.813 0.459
32 IND 15 - 1 0.938 0.452

That's assuming the Packers lose their remaining 3 games. You'll notice that if they win even one of their last 3, they move from 4th to 10th overall. As it works out, if they beat the Ravens tonight, they might as well win the rest of them, since it will only knock them down about 3 more picks.

If you would like to play around yourselves. Just download this excel spreadsheet:

DraftOrder.xls

It uses a macro to sort the draft order, so if you have high security on, it ain't going to work. You'll have to turn it down to medium or sort it manually. If you do it manually, be sure to sort by winning % first, then SOS (both ascending).

Let me know if anyone finds any mistakes or has any suggestions!

EDIT: Well I found a mistake. While I updated the team's SOS based on changes of win % for opponents of the last 2 weeks, I needed to go back and do it for all 16 weeks. It takes a long time to put the whole schedule in for each team, so I only did it for any team with a losing record at week 14 (14 teams). Good enough for now.

Basic Runs Created

Brewerfan.net is having it's annual discussion about the significance of OPS.

.OPS is just a trend, so it's not my friend

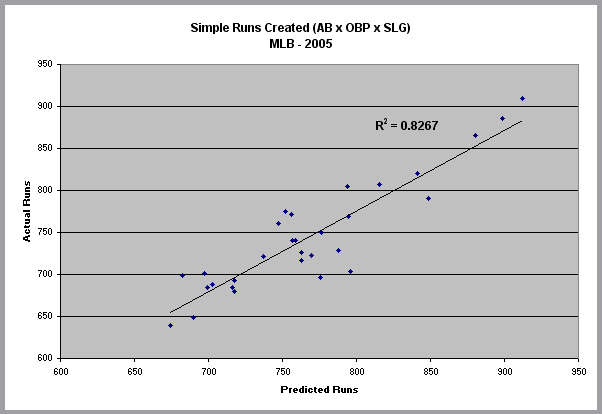
I tried to use Basic Runs Created to show the power of OBP and SLG. The basic version of Bill James' Run Created Formula is:

Runs = AB x OBP x SLG

Let's see how well that formula does at predicting runs scored using 2005 team stats:

Image hosted by Photobucket.com

Pretty darn good!

Sunday, December 18, 2005

MLB 05' Batting Averages by Position

It's fun to watch the defensive spectrum at work. The defensive spectrum is yet another Bill James concoction. From the Bill James 1988 Abstract:

"[ - - 1B - LF - RF - 3B - CF - 2B - SS - C - - ]
with the basic premise being that positions at the right end of
the spectrum are more difficult than the positions at the left
end of the spectrum. Players can generally move from right
to left along the specturm successfully during their careers."


Let's look at averages at each position in 2005, ordering them by OPS:

POS LG AVG OBP SLG ISO OPS

1B NL 0.280 0.361 0.482 0.202 0.843
AL 0.271 0.343 0.457 0.187 0.800
MLB 0.276 0.352 0.470 0.195 0.822


RF NL 0.269 0.346 0.457 0.188 0.803
AL 0.270 0.332 0.451 0.181 0.783
MLB 0.270 0.339 0.454 0.185 0.793


LF NL 0.272 0.348 0.457 0.185 0.805
AL 0.278 0.333 0.437 0.158 0.770
MLB 0.275 0.341 0.447 0.172 0.788


3B NL 0.274 0.344 0.442 0.168 0.786
AL 0.266 0.329 0.428 0.161 0.757
MLB 0.270 0.337 0.435 0.165 0.772


CF NL 0.275 0.340 0.437 0.162 0.777
AL 0.268 0.322 0.407 0.139 0.729
MLB 0.272 0.331 0.422 0.151 0.753


2B NL 0.276 0.338 0.414 0.138 0.752
AL 0.271 0.323 0.413 0.142 0.736
MLB 0.274 0.331 0.414 0.140 0.744


SS NL 0.265 0.313 0.379 0.114 0.692
AL 0.276 0.331 0.412 0.136 0.743
MLB 0.271 0.322 0.396 0.125 0.718


C NL 0.250 0.313 0.388 0.138 0.701
AL 0.257 0.313 0.393 0.136 0.706
MLB 0.254 0.313 0.391 0.137 0.704

------------------------------------------------
DH NL 0.249 0.331 0.383 0.134 0.714
AL 0.259 0.337 0.440 0.182 0.777
MLB 0.254 0.334 0.412 0.158 0.746


I put DH at the end, since they are the oddball group. Anyway, They line up almost exactly as teh defensive spectrum would put them , assuming the more difficult a position is to play, the worse the offensive stats from that position will be. Only LF and RF are in the wrong order, which isn't suprising since the defensive difference between the two is very small.

It's pretty interesting to notice the difference between AL and NL averages for DH's. That is quite the advantage in interleague play.

Plate Appearance Outcomes - Brewer Batters

Here are the Plate appearance outcomes for every Brewer batter with 50 or more PA in 2005:

Player PA K BB GB OF IF LD Oth
Lee C. 688 13% 9% 26% 30% 6% 16% 0%
Clark B. 674 8% 10% 30% 26% 4% 21% 2%
Overbay L. 622 16% 13% 36% 18% 1% 15% 0%
Jenkins G. 618 22% 12% 26% 21% 1% 17% 0%
Hall B. 546 19% 7% 31% 22% 3% 17% 1%
Miller D. 431 22% 10% 34% 16% 1% 17% 0%
Hardy J. 427 11% 11% 33% 22% 5% 15% 3%
Weeks R. 414 23% 12% 31% 17% 3% 13% 1%
Branyan R. 242 33% 16% 14% 22% 2% 12% 1%
Cirillo J. 219 10% 12% 37% 21% 4% 12% 5%
Moeller C. 216 22% 6% 32% 20% 7% 9% 3%
Spivey J. 202 28% 9% 26% 21% 2% 11% 1%
Helms W. 188 16% 9% 33% 27% 2% 13% 0%
Magruder C 155 21% 8% 33% 25% 3% 8% 3%
Capuano C. 79 42% 3% 24% 11% 4% 9% 8%
Davis D. 76 45% 1% 34% 4% 0% 11% 5%
Hart C. 63 17% 10% 40% 14% 3% 16% 0%
Fielder P. 62 27% 3% 26% 16% 3% 24% 0%
Sheets B. 53 32% 2% 25% 6% 6% 6% 25%

And for reference, here's the MLB averages, along with the average run value for each plate appearance outcome:

K BB GB OF IF LD
MLB Ave 16% 9% 32% 22% 3% 15%
Run Value -.287 .304 -.101 .035 -.243 .356

Friday, December 16, 2005

The HR Derby Ruined Lee's Stroke?

It has been suggested by posters at Brewerfan.net and Carlos Lee himself that his poor production in the second half was a result of the HR Derby. The theory is that swinging for the fences for a few minutes caused Lee to change his swing. The pre and post all star splits is usually given as "proof":

AB AVE OBP SLG OPS
Pre-All Star 339 .268 .336 .528 .864
Post-All Star 279 .262 .309 .437 .746

His slide actually began a full month before that, however:

AB AVE OBP SLG OPS
6/13 - 7/13 94 .213 .300 .426 .726

As I asked on brewerfan.net, doesn't the effect have to occur after the cause? Let's look at one final split:

AB AVE OBP SLG OPS
Before June 13 245 .290 .351 .567 .918
After June 13 373 .249 .307 .434 .741

Now, if we can just figure out what happened the morning of the 13th, the mystery will be solved! :)

Text Based Tables in Blogspot

OK, I'm getting really pissed off. It seems like making text tables SHOULD be very easy. I do it at brewerfan.net by using a monospaced font in notepad, and pasting that into my post, between two "code" tags. The html equivelant is the "pre" tag, which keeps all the spaces in order, but the "br" tag puts an ugly double spacing between each row.

EDIT: Dan Fox helped me out. I had to set the font size manually but it looks pretty good now. Let's look at those 06 ZiPS projections again, adding AB estimates:


AB AVE OBP SLG
Miller C 375 0.248 0.318 0.384
Fielder 1B 550 0.268 0.352 0.482
Weeks 2B 550 0.252 0.350 0.434
Hardy SS 550 0.253 0.329 0.403
Hall 3B 500 0.279 0.325 0.453
Lee LF 600 0.277 0.336 0.481
Clark CF 600 0.291 0.364 0.414
Jenkins RF 500 0.281 0.356 0.490
Branyan 3B 200 0.251 0.347 0.499
Hart OF/1B 250 0.261 0.324 0.450
Moeller C 250 0.217 0.274 0.345
Cirillo 3b 200 0.233 0.318 0.342
Cruz lf 200 0.258 0.342 0.457

I was going to use this to estimate total team runs scored, but it's stupid not to relate total team PA to their OBP. Another day...

Plate Appearance Outcomes - Brewer Pitchers

The guys at Hardball Times made plate appearance outcomes available to those who bought their THT Annual. I recommend it to anyone.

Anyway, here they are for the Brewers pitchers:


Player BFP K BB GB OF IF LD Oth
Capuano C. 949 19% 11% 26% 23% 5% 14% 2%
Davis D. 946 22% 10% 28% 20% 3% 13% 3%
Santos V. 639 14% 10% 31% 25% 2% 17% 1%
Sheets B. 633 22% 4% 26% 27% 3% 15% 2%
Ohka T. 543 15% 6% 33% 23% 4% 17% 2%
Obermueller 305 11% 13% 34% 19% 5% 16% 2%
Glover G. 284 20% 8% 30% 22% 4% 15% 1%
Turnbow D. 271 24% 9% 33% 17% 1% 14% 1%
Wise M. 262 24% 11% 26% 27% 3% 8% 2%
de la Rosa J 208 20% 18% 30% 13% 4% 14% 1%
Helling R. 199 21% 10% 21% 29% 6% 13% 1%
Bottalico R. 188 15% 12% 34% 23% 2% 12% 2%
Santana J. 177 28% 11% 20% 25% 4% 11% 1%
Lehr J. 154 15% 12% 34% 20% 3% 14% 2%
Eveland D. 146 16% 13% 36% 16% 1% 17% 1%
Phelps T. 106 13% 13% 36% 15% 3% 18% 2%
Davis K. 70 16% 14% 29% 21% 7% 11% 1%
Capellan J. 67 21% 7% 27% 15% 10% 15% 4%
Adams M. 61 23% 16% 23% 21% 2% 13% 2%


Line drives fall for hits about 74% of the time (much higher than any other BIP type). Generally, pitchers don't have much control over their LD%, with the exception being uber-changeup and knuckleball pitchers. Wise is one of those uber-changeup guys, which is why he had such a low LD% and had the lowest BABIP in the entire league.

Wednesday, December 14, 2005

Brewer ZiPS Projections - 2006

www.baseballthinkfactory.org/files/oracle/discussion/34328/


Name P AVG OBP SPC G AB R H 2B 3B HR RBI BB K SB CS
Jenkins lf .281 .356 .490 147 563 83 158 39 2 25 93 55 139 1 0
Overbay 1b .284 .375 .448 154 531 74 151 40 1 15 73 78 106 1 0
Branyan 3b .251 .347 .499 117 355 52 89 20 1 22 64 50 128 3 2
Fielder 1b .268 .352 .482 142 452 70 121 20 1 25 78 52 105 11 4
Lee lf .277 .336 .481 160 622 90 172 40 0 29 106 54 88 12 6
Weeks 2b .252 .350 .434 148 535 88 135 26 7 19 75 56 142 22 4
Cruz lf .258 .342 .457 123 403 65 104 23 0 19 60 42 124 12 6
Clark cf .291 .364 .414 141 498 69 145 26 1 11 56 44 51 10 11
Helms 3b .269 .340 .424 111 335 34 90 17 1 11 45 31 81 0 1
Hall ss .279 .325 .453 144 495 68 138 33 4 15 67 35 112 14 8
Hart rf .261 .324 .450 134 467 80 122 25 6 17 67 42 102 20 9
Hardy ss .253 .329 .403 112 340 45 86 19 1 10 47 39 44 0 0
Miller c .248 .318 .384 112 375 39 93 22 1 9 45 37 89 0 1
Gemoll 1b .263 .315 .385 123 418 48 110 23 2 8 49 30 107 3 4
Nelson 1b .238 .308 .384 138 487 66 116 22 2 15 63 47 140 8 3
Dallimore 2b .264 .322 .358 113 405 56 107 21 1 5 41 28 53 5 5
Erickson 2b .256 .343 .329 103 313 35 80 18 1 1 26 33 56 10 8
Johnson c .226 .332 .335 76 221 27 50 13 1 3 23 34 35 1 2
Abernathy 2b .253 .313 .365 101 348 54 88 19 1 6 39 28 36 11 9
Cirillo 3b .233 .318 .342 74 193 23 45 12 0 3 20 21 24 2 2
Rivera c .235 .279 .397 67 234 27 55 9 1 9 32 11 53 1 1
Rottino 1b .256 .298 .358 137 497 60 127 19 4 8 55 29 78 2 2
Cruz 3b .244 .292 .377 139 472 60 115 23 2 12 51 30 118 5 5
Scarborough ss .226 .290 .353 127 394 42 89 25 2 7 42 32 100 3 4
Krynzel cf .225 .286 .346 113 408 59 92 17 4 8 42 30 130 14 7
Sorensen 2b .248 .311 .314 106 347 56 86 13 2 2 31 33 69 9 8
Moeller c .217 .274 .345 83 258 24 56 13 1 6 27 19 56 0 1
Gwynn cf .234 .309 .291 138 512 76 120 17 3 2 38 51 91 31 15
Knox cf .233 .289 .318 114 374 47 87 18 1 4 30 26 83 21 11
Crabbe 2b .220 .289 .284 127 437 52 96 14 4 2 32 39 70 18 7
Borders c .212 .247 .297 72 222 20 47 10 0 3 22 8 56 1 1


Name W L ERA G GS INN H ER HR BB K
Sheets 15 8 3.27 29 29 198.0 180 72 23 32 191
Wise 4 3 3.46 44 2 65.0 53 25 6 23 61
Turnbow 5 3 3.65 59 0 74.0 60 30 7 31 79
Davis 4 3 4.14 50 0 63.0 54 29 7 31 66
Davis 11 12 4.26 34 34 203.0 189 96 21 85 175
Capellan 5 6 4.32 58 8 102.0 99 49 7 46 84
Ohka 9 10 4.45 30 28 168.0 181 83 20 45 95
Gamble 3 4 4.50 22 8 66.0 70 33 7 22 41
Eveland 7 9 4.53 37 19 141.0 152 71 14 46 94
Capuano 12 13 4.55 32 31 182.0 176 92 24 73 153
Adams 3 4 4.57 47 1 67.0 65 34 9 28 65
Hendrickson 8 11 4.71 28 27 149.0 159 78 19 49 106
Lehr 5 7 4.76 52 7 102.0 106 54 12 41 72
Saenz 5 6 4.87 15 15 85.0 84 46 17 28 80
Helling 6 9 4.91 32 25 152.0 158 83 22 58 111
Bennett 2 3 4.94 54 0 62.0 64 34 10 24 48
Obermueller 6 9 5.07 31 23 158.0 174 89 19 64 89
de la Rosa 3 6 5.26 41 2 53.0 54 31 4 35 46
Wolfe 3 5 5.34 36 3 64.0 71 38 8 27 34
Woolard 6 10 5.35 30 23 143.0 159 85 19 63 92
Fernandez 5 12 5.51 31 25 165.0 190 101 28 55 73
Diggins 1 2 5.63 10 5 32.0 32 20 2 23 20
Zumwalt 2 5 5.68 41 0 65.0 68 41 9 39 47
Costello 6 12 5.86 32 23 132.0 150 86 23 63 85
Jones 1 4 6.14 6 6 22.0 22 15 1 20 14
Pratt 3 7 6.20 34 16 103.0 101 71 17 79 100
Weibl 2 5 6.35 30 8 78.0 91 55 16 39 50
Habel 5 12 6.39 31 20 124.0 146 88 31 53 85
Sarfate 5 14 6.42 27 25 129.0 143 92 23 83 93
Housman 4 12 6.47 28 24 128.0 143 92 29 69 104

Hello World!

Ahhh, excellent. Start em' off with a computer programming reference. They'll just LOVE that! I have no idea what the exact purpose of this blog will be. It's quite possible it will go extinct within a month of it's creation (like most new blogs do). I envision this blog being used as a catalog of sorts, for all my sabermetric ramblings over at brewerfan.net. I sometimes spend a good deal of time on some of my posts there, and it pains me to see them vanish into ezboard nothingness.You won't find any self indulgence here (I hope). OK, I'm not promising anything.