Contact rate and OPS
"The Book" mentioned that players with a lower contact rate tend to have greater offensive value as a result of their walks. Is it really just the walks?
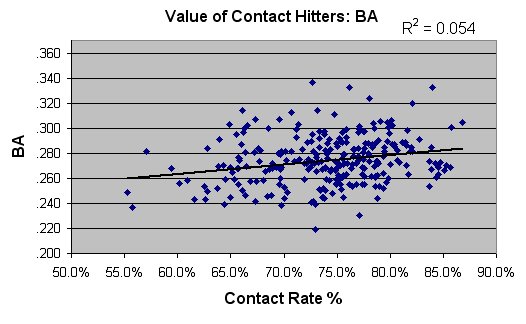
I looked at all active players with at least 1500 AB and defined contact rate as (AB-K)/PA. That's simply the percentage of plate appearances that a player puts the ball in play. I then looked at the linear correlation between contact rate and various metrics. First, batting average:

Not a very high correlation, but there's a slight trend for batting average to increase with contact rate. How about OBP?

Better correlation than BA and as expected, OBP increases with a decrease in contact rate. This makes sense, since players that strike out a lot often times have their share of walks as well.
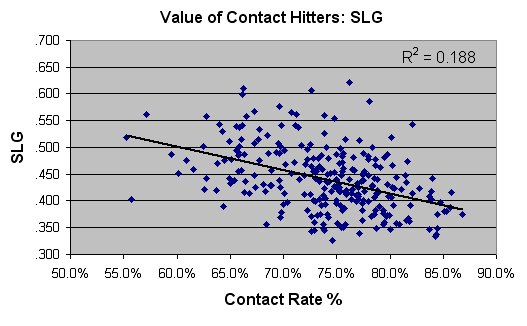
What about SLG? Since batting average is a component of SLG and BA increases with a higher contact rate, will SLG increase with contact rate as well?

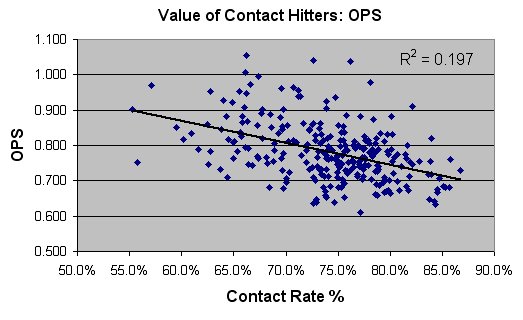
Nope. SLG increases with decreasing contact rate. It also correlates better with contact rate than either BA or OBP. Finally, OPS:

OPS correlates better with contact rate than anything else. There's a clear inverse relationship between contact rate and OPS.
I'm obviously not trying to claim that there's a direct cause and effect relationship between striking out and increased offensive production. Neifi Perez won't raise his OPS by simply striking out more. This may suggest the type of player/approach that generally has the most offensive value, however. Players that strike out more often are also generally more patient at the plate. That patience generally allows them to walk more and to theoretically see better pitches that they can drive.
For fun, let's look at the top and bottom 10 contact hitters. First, the top 10:
And the bottom 10 in contact rate:
EDIT: There's some discussion of this post over at Baseball Primer. Makes me wish I had spent more time on it. :)
I looked at all active players with at least 1500 AB and defined contact rate as (AB-K)/PA. That's simply the percentage of plate appearances that a player puts the ball in play. I then looked at the linear correlation between contact rate and various metrics. First, batting average:
Not a very high correlation, but there's a slight trend for batting average to increase with contact rate. How about OBP?

Better correlation than BA and as expected, OBP increases with a decrease in contact rate. This makes sense, since players that strike out a lot often times have their share of walks as well.
What about SLG? Since batting average is a component of SLG and BA increases with a higher contact rate, will SLG increase with contact rate as well?
Nope. SLG increases with decreasing contact rate. It also correlates better with contact rate than either BA or OBP. Finally, OPS:
OPS correlates better with contact rate than anything else. There's a clear inverse relationship between contact rate and OPS.
I'm obviously not trying to claim that there's a direct cause and effect relationship between striking out and increased offensive production. Neifi Perez won't raise his OPS by simply striking out more. This may suggest the type of player/approach that generally has the most offensive value, however. Players that strike out more often are also generally more patient at the plate. That patience generally allows them to walk more and to theoretically see better pitches that they can drive.
For fun, let's look at the top and bottom 10 contact hitters. First, the top 10:
Name AB AVG OBP SLG OPS Cont%Yuk. Not an impressive list at all. With the exception of Polonco, none of these players are very good, in terms of OPS. To be fair, Ichiro has the 11th highest contact rate and has an OPS over .800. He is definetely the exception to the rule, though.
J. Pierre 3411 .305 .355 .375 0.730 86.8%
P. Polanco 3265 .300 .346 .415 0.761 85.8%
D. Cruz 4124 .269 .293 .388 0.682 85.7%
N. Perez 4762 .270 .301 .380 0.681 85.3%
T. Hall 1829 .266 .303 .381 0.683 85.1%
B. Molina 2484 .273 .309 .397 0.705 84.8%
L. Harris 3924 .269 .318 .349 0.667 84.5%
T. Perez 1550 .263 .302 .374 0.676 84.5%
C. Izturi 2245 .261 .295 .338 0.633 84.4%
R. Sanchez 4850 .272 .308 .334 0.642 84.3%
And the bottom 10 in contact rate:
Name AB AVG OBP SLG OPS Cont%There's some pretty darn good players in there. Adam Dunn puts the ball in play in only 55% of his plate appearances, yet has found a way to stay very productive. Maybe just "putting the ball in play" isn't the best way to approach an AB?
A. Dunn 2271 .248 .383 .518 0.901 55.3%
M. Bellhorn 1840 .236 .349 .403 0.753 55.7%
J. Thome 5919 .281 .408 .562 0.970 57.1%
C. Wilson 1593 .268 .363 .488 0.851 59.5%
B. Wilker'n 2265 .256 .365 .452 0.817 60.1%
P. Burrell 3065 .258 .358 .476 0.834 60.9%
C. Pena 1652 .243 .330 .459 0.790 61.6%
T. Glaus 3500 .253 .358 .501 0.859 62.5%
J. LaRue 2035 .243 .326 .421 0.747 62.6%
M. Cameron 4329 .249 .340 .442 0.783 62.8%
EDIT: There's some discussion of this post over at Baseball Primer. Makes me wish I had spent more time on it. :)
posted by rluzinski at 8:56 AM
![]()
![]()

3 Comments:
Russ, I have a comment on those R-squared vals. I can see the line and possible trend, but the R-squared vals are less than .2, which is very low. Every scatter plot can have a line of best fit that runs through it with some type of slope.
That means that less than 20% of the trend is explained by the correlation of one of the stats to the other, correct?
What do you think? Agree/Disagree?
That means that less than 20% of the trend is explained by the correlation of one of the stats to the other, correct?
Yes, and I didn't expect a very high coorelation anyway. It's pretty obvious that contact rate would only be a small piece of the euqtion anyway. Still, it seems that there is a clear trend and a .19 coorelation shouldn't be ignored.
If I am going to use the word "correlation", I should probably spell it right. :)
I'd like to add that in this study, N = 260. With that size of sample, the .054 correlation for BA could reasonably be a result of chance. As such, it shouldn't even be considered.
The OBP correlation is significant, however. The probability is less than .01 that the correlations occured by chance. From the BTF comments, someone pointed out that the correlation could be the sole result of cross-dependancy of "contact rate" and OBP from walks. From what I can gather, that makes it's r^2 meaningless.
SLG is another matter. No cross-dependancy exists and r^2 is even higher (.0005 prob. of correlation occuring by chance). While correlation does not imply causation, it's clear that contact rate (as I defined it) and SLG are somehow interconnected. It very well may be a selection bias, but so what? I'm not trying to prove causation anyway. Just that certain players with a certain approach might be more valuable.
Post a Comment
<< Home