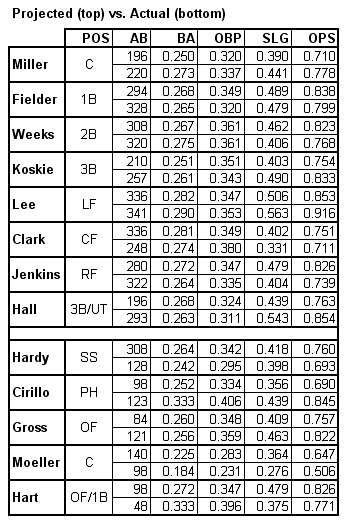
Brewer Batters Midseason Glance - Projection vs. Actual
I thought it would be interesting to take a look back at those PECOTA projections and see how the Brewer batters have been doing with respect to their best-guess expectations. Projected ABs are based on my best pre-season guesses for playing time (making sure total season team PAs agreed with what would be expected from their team OBP). Here you go:

It looks like some have significantly over performed (Miller, Lee, Koskie, Hall) while others have been a major disappointment so far(Jenkins, Weeks, Hardy stand out). What is the end result? Well, if we throw in some pitcher PAs (I assumed the same performance as last year), we can project their overall expected team stats, including projected runs per game (using Basic Runs Created). Let's do that and compare the result to the actual current team stats:

Higher BA than expected? Check.
Higher OBP? Check.
Higher SLG? Check.
Higher RPG? Nope!
What the hell!? Unfortunately, while the raw stats have been better than expected, the end result is not so rosy. Basic RC estimates that the Brewers should have averaged 5.00 RPG over their first 90 games. BaseRuns puts it at 4.82 RPG. Even the more conservative of the two says the Crew scored 23 less runs than expected. In terms of RPG, let's look at where the Brewers should be ranked(using BsR) and actually do rank in the NL:
Coulda, woulda, shoulda. Why did they score less runs than expected? When run estimators miss their mark, it's usually because of atypical production in run producing situations. Let's compare the Brewers’ overall stats with their stats w/RISP:

It looks like some have significantly over performed (Miller, Lee, Koskie, Hall) while others have been a major disappointment so far(Jenkins, Weeks, Hardy stand out). What is the end result? Well, if we throw in some pitcher PAs (I assumed the same performance as last year), we can project their overall expected team stats, including projected runs per game (using Basic Runs Created). Let's do that and compare the result to the actual current team stats:

Higher BA than expected? Check.
Higher OBP? Check.
Higher SLG? Check.
Higher RPG? Nope!
What the hell!? Unfortunately, while the raw stats have been better than expected, the end result is not so rosy. Basic RC estimates that the Brewers should have averaged 5.00 RPG over their first 90 games. BaseRuns puts it at 4.82 RPG. Even the more conservative of the two says the Crew scored 23 less runs than expected. In terms of RPG, let's look at where the Brewers should be ranked(using BsR) and actually do rank in the NL:
RPGJust 23 extra runs moves them from well below average to a pretty respectable offense. It would have also translated into at least a couple of extra wins, probably putting the Brewers right in the thick of things in the NL Central and the wildcard race.
LA Dodgers 5.31
NY Mets 5.31
Cincinnati 5.08
St. Louis 5.03
Atlanta 4.94
Arizona 4.88
Phili 4.83
Mil (Proj.) 4.82
Colorado 4.75
Florida 4.71
San Fran 4.71
Houston 4.59
Mil (Actual) 4.57
Pittsburgh 4.57
Washington 4.52
San Diego 4.47
Chicago Cubs 4.06
------------------
4.77
Coulda, woulda, shoulda. Why did they score less runs than expected? When run estimators miss their mark, it's usually because of atypical production in run producing situations. Let's compare the Brewers’ overall stats with their stats w/RISP:
Brewers, 2006And the NL as a whole:
BA OBP SLG OPS
Overall 0.261 0.330 0.432 0.762
w/RISP 0.262 0.354 0.405 0.759
NL, 2006While the Brewers' OBP rises as expected, they lose much more power in those situations than the average NL team does. That lost 27 points of SLG w/RISP is probably the main reason why the Brewers' offense has underperformed in the first half. It will be interesting to revisit this at the end of the season to see if the trend holds up. It might help answer the question of whether this is simply a result of bad luck or a bad team approach at the plate w/RISP.
BA OBP SLG OPS
Overall 0.265 0.334 0.425 0.759
w/RISP 0.267 0.355 0.422 0.777

2 Comments:
This makes me think they may be about to explode (in a good way).
I can't believe Fielder has a .320 OBP. That basically sucks. I definitely expected much more, and I think we'll get it in the second half, but that's putrid.
Jenkins, 2006
SLG Overall: .404
SLG w/RISP: .506
Overall, Jenkins has been great with RISP this year (.902 OPS).
Post a Comment
<< Home