Run Distributions Revisited
With Melvin talking about the supposed inconsistency of the Brewers' offense, I thought it would be a good time to revisit the run distributions for runs scored and allowed. I followed the same procedure as I did last time, expect I'm now using Tangotiger's nice little program to find the expected run distributions. This allows me to plug in the Brewers' exact RPG for and against.
Let's look at runs scored first:
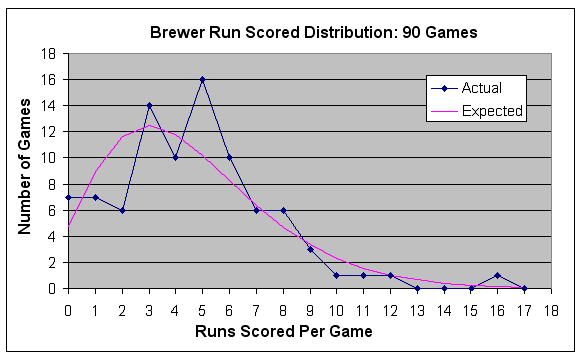
While the Brewers have scored exactly 2 runs in a game less often than expected, they've scored 3 and 5 runs more often than expected. That's generally a good a thing, since they are only going to win a small percentage of games where they score only 2 runs anyway. Overall, it looks like a pretty typical run distribution to me. Unless Melvin's definition of consistency is different than mine, I simply don’t know what he's talking about.
On to runs given up:
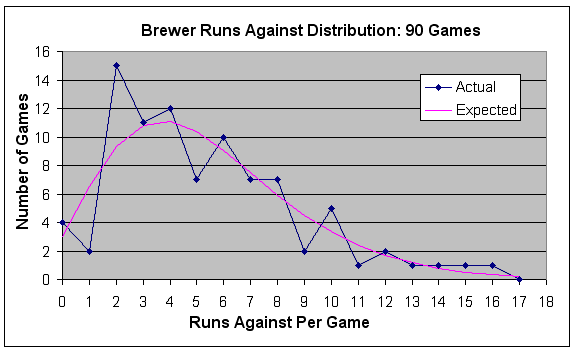
What sticks out is how often the pitching staff has only given up 2 runs (15) compared with expected (only about 9). Of course, they've also been blasted for 10 or more runs 12 times, which comes with the territory of averaging 5.4 RPG against I guess.
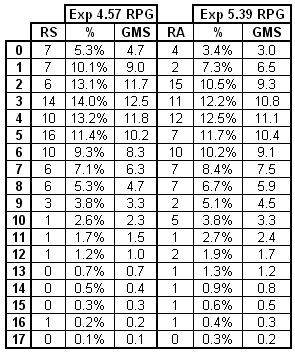
Here's a summary table:
I'll be looking at expected record based off of different run distributions in the near future. Stay tuned.
Let's look at runs scored first:
While the Brewers have scored exactly 2 runs in a game less often than expected, they've scored 3 and 5 runs more often than expected. That's generally a good a thing, since they are only going to win a small percentage of games where they score only 2 runs anyway. Overall, it looks like a pretty typical run distribution to me. Unless Melvin's definition of consistency is different than mine, I simply don’t know what he's talking about.
On to runs given up:
What sticks out is how often the pitching staff has only given up 2 runs (15) compared with expected (only about 9). Of course, they've also been blasted for 10 or more runs 12 times, which comes with the territory of averaging 5.4 RPG against I guess.
Here's a summary table:
I'll be looking at expected record based off of different run distributions in the near future. Stay tuned.
posted by rluzinski at 11:50 PM
![]()
![]()

3 Comments:
What would be interesting is if you had their actual record and expected record when they scored each amount.
Obviously when they score 0 runs their expected record would be 0-8, but what is their expected record in the 8 games they socre 1 run. Is it 0-8 as well and what is the actual record.
I think all you have to do is look at the % time your team will score below what you are interested in looking at. For instance, if you want to know how often the Brewers should win games in which they score 2 runs, look at how often a pitching staff that gives up 5.39 RPG should only give up zero or 1 runs:
3.4% + 7.3% = 10.7%
The Brewers have scored 2 runs 6 times and are expected to win 10.7% of those, or about .6 times. They have 1 actual win in those games (1-5 overall record).
What goes into the "Expected Runs Scored" equation?
Those variables may be what Melvin is using to claim inconsistancy from the offense.
Post a Comment
<< Home