I hate Win Probability Charts!
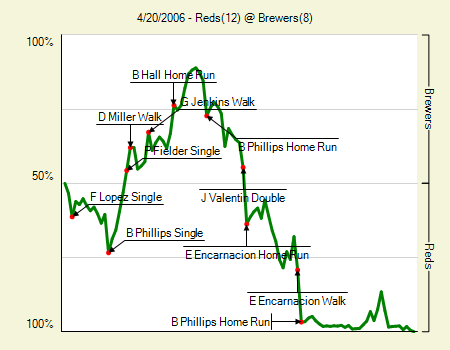
OK, I really don't hate win probability charts but they are sure are depressing to look at when your favorite team blows a huge lead. Here's the win probability chart for yesterday's Brewer game against the Reds (thank you, fangraphs.com!):

They went from about a 90% chance of winning (up by 4 in the bottom of the 3rd, 2 on and 2 out) to about a 98% chance of losing (down 10 in the top of the 6th, 2 out) in the span of 3 innings. Lucky for me, I was in attendance and able to watch them unravel first hand!
Let's look at the lagers in the WPA category:
T Ohka -32.1 %
M Adams -28.3 %
J Lehr -13.7 %
C Lee -7.9 %
This illustrates a limitation of WPA as it's constructed here. It makes no consideration for good or bad fielding and instead gives the pitcher all the credit or blame. For instance, in the third, Carlos Lee should probably have made a fairly easy catch of a blooper in medium left. Instead, he pulled up just short, resulting in the ball bouncing first off the ground and then off his glove. Instead of an out, a runner scored and the batter ended up at third. At least some of the win probability lost should be credited to Lee instead of Ohka but exactly how to do that is a little subjective. How can we quantify it?
To separate fielding from pitching in WP, you could use one of the more advanced PBP-based defensive metrics to allocate responsibility between fielder and pitcher on each play. Defensive metrics (like PMR) spit out the probability of a defender making a play, which could be used to divvy up the responsibility of a good or bad play. For instance, if the WPA for a particular double allowed was -12% and the average defender is found to make that play 50% of the time, -6% of the WPA could be credited to the defender and -6% to the pitcher. Throw in some responsibility to the defender for base advancements and you'd be all set.
I'm sure it's just a matter of time...

1 Comments:
It also fully punishes Adams for pitching with the bases loaded by DLR.
Post a Comment
<< Home