Saturday, March 25, 2006

Melvin's MLB Webchat

Brewer GM Doug Melvin participated in a webchat at MLB.com on Friday. You can find the log here. Melvin makes an interesting comment about how Hart will be used this year. He said Hart would play some outfield would also be given some starts at 1B against lefties. Does that mean Fielder will only see a portion of the left handed pitchers or none at all? Is Cirillo going to get some starts against lefties at 1B? I sure hope not.

Melvin also mentioned that Hall would get a few more starts in CF before spring training ended. Does he not trust Hart to be the primary backup in CF or anticipate Clark being traded later? Who knows. I wouldn't think Mevlin would rather have Hall's stick in the lineup over Hart but what do I know.

Friday, March 24, 2006

Simulated 2006 Season Standings

The guys over at Replacement Level Yankees Weblog have posted an article with 2006 season predictions. They used the Diamond Mind game/simulator and various player projection systems to run simulations of 1000 seasons for each system. I'll focus on the simulations based off the PECOTA player projections, since I feel that the guys over at Baseball Prospectus have the most accurate projection system system to date:

2006 Standings, PECOTA

The average number of wins for the Brewers over the course of 1,000 full season simulations was 84. Not bad, but the exciting part is the Crew's chances of making the post season. In 25% of the simulated seasons, the Brewers advanced to post season play. They won the division in 122 of the 1,000 simulated seasons and won the wild card in 130 others. When was the last time the Brewers had a one in four shot of making the playoffs by anyone's prediction?

Anyone who owns the Diamond Mind software can download a file that I think contains all the lineups and pitchers used. If anyone checks it out, please let me know what they used for the Crew.

Wednesday, March 22, 2006

Jenkins Plays Too Deep?

Anyone who's watched Jenkins play defense knows that he plays very deep in the outfield. I've finally found statistical proof of that, however. The Fielding Bible lists hit charts, indicating where hits fell for vairous teams. As indicated in this HBT article, one chart ranks teams with the most hits in front of the fight fielder. Wouldn't you know that Milwuakee ranks 5th, where Jenkins played the majority of innings at RF last year. Here's the complete table:
Front of RF:

Team Most

CHC 140
OAK 138
TOR 135
WAS 130
MIL 126
SFG 126

It's no wonder Jenkins always seems to be diving at balls in front of him! He must really be uncomfortable with going back on a fly ball.

EDIT: I have been corrected. The above list refers to the number of hits the Brewers' offense had in front of the right fielder, not yielded. Ironically, as a lefty, Jenkins probably contributed nicely to that total. I promise to sharpen my reading comprehension skills in the near future.

Friday, March 17, 2006

Negative Thread Generator

Feeling in a crumby mood? Want to take it out on a Brewer player using Brewerfan.net without having the hastle of coming up with your own title? Well, today is your lucky day! Just download rluzinski's negative thread generator!

You'd rather post at other Brewer messageboards? No problem! This generator will also work on milwaukeebrewers.com, espn.com, JSonline and others!


CLICK TO DOWNLOAD

Examples:
Dana Eveland: Has small feet?
Doug Davis: Scared of Koreans?
Hernan Iribarren: Enjoyed "Glitter"?

Any many, many more!

Post your own negative comment here and I'll be sure to add it to the generator. Get your negative thread generator today!

Thursday, March 16, 2006

Contact rate and OPS

"The Book" mentioned that players with a lower contact rate tend to have greater offensive value as a result of their walks. Is it really just the walks?

I looked at all active players with at least 1500 AB and defined contact rate as (AB-K)/PA. That's simply the percentage of plate appearances that a player puts the ball in play. I then looked at the linear correlation between contact rate and various metrics. First, batting average:


Not a very high correlation, but there's a slight trend for batting average to increase with contact rate. How about OBP?


Better correlation than BA and as expected, OBP increases with a decrease in contact rate. This makes sense, since players that strike out a lot often times have their share of walks as well.

What about SLG? Since batting average is a component of SLG and BA increases with a higher contact rate, will SLG increase with contact rate as well?


Nope. SLG increases with decreasing contact rate. It also correlates better with contact rate than either BA or OBP. Finally, OPS:


OPS correlates better with contact rate than anything else. There's a clear inverse relationship between contact rate and OPS.

I'm obviously not trying to claim that there's a direct cause and effect relationship between striking out and increased offensive production. Neifi Perez won't raise his OPS by simply striking out more. This may suggest the type of player/approach that generally has the most offensive value, however. Players that strike out more often are also generally more patient at the plate. That patience generally allows them to walk more and to theoretically see better pitches that they can drive.

For fun, let's look at the top and bottom 10 contact hitters. First, the top 10:
Name          AB  AVG  OBP  SLG    OPS  Cont%
J. Pierre 3411 .305 .355 .375 0.730 86.8%
P. Polanco 3265 .300 .346 .415 0.761 85.8%
D. Cruz 4124 .269 .293 .388 0.682 85.7%
N. Perez 4762 .270 .301 .380 0.681 85.3%
T. Hall 1829 .266 .303 .381 0.683 85.1%
B. Molina 2484 .273 .309 .397 0.705 84.8%
L. Harris 3924 .269 .318 .349 0.667 84.5%
T. Perez 1550 .263 .302 .374 0.676 84.5%
C. Izturi 2245 .261 .295 .338 0.633 84.4%
R. Sanchez 4850 .272 .308 .334 0.642 84.3%
Yuk. Not an impressive list at all. With the exception of Polonco, none of these players are very good, in terms of OPS. To be fair, Ichiro has the 11th highest contact rate and has an OPS over .800. He is definetely the exception to the rule, though.

And the bottom 10 in contact rate:
Name          AB  AVG  OBP  SLG    OPS  Cont%
A. Dunn 2271 .248 .383 .518 0.901 55.3%
M. Bellhorn 1840 .236 .349 .403 0.753 55.7%
J. Thome 5919 .281 .408 .562 0.970 57.1%
C. Wilson 1593 .268 .363 .488 0.851 59.5%
B. Wilker'n 2265 .256 .365 .452 0.817 60.1%
P. Burrell 3065 .258 .358 .476 0.834 60.9%
C. Pena 1652 .243 .330 .459 0.790 61.6%
T. Glaus 3500 .253 .358 .501 0.859 62.5%
J. LaRue 2035 .243 .326 .421 0.747 62.6%
M. Cameron 4329 .249 .340 .442 0.783 62.8%
There's some pretty darn good players in there. Adam Dunn puts the ball in play in only 55% of his plate appearances, yet has found a way to stay very productive. Maybe just "putting the ball in play" isn't the best way to approach an AB?

EDIT: There's some discussion of this post over at Baseball Primer. Makes me wish I had spent more time on it. :)

Tuesday, March 14, 2006

Clark's Spring Stats & Leadoff Hitters

There's a rule in baseball that if a veteran has questionable spring training stats someone HAS to overreact. This rule is worshiped in Brewer Nation, where fans have learned long ago that if something can go wrong it will. This year's victim? Brady Clark:
       AB BB  SO   BA  OBP  SLG
Clark 26 9 11 .231 .474 .385
We'll pretend for a moment that 26 ABs are enough to be worth studying. Low BA, mediocre SLG, great OBP (being very dependant on walks) and a whole lot of K's. The question is, would this be a good line for an NL leadoff hitter over the course of a full season?

Using linear weights, we know that in an average situation (average number of plate appearances for each of the 24 base/out situations) a walk is worth about 2/3rds of a single and a strike out is slightly worse than a BIP out. These run values are very dependant on the base/out situation, so a batter subjected to atypical situations will have atypical average values for their batting events.

Tangotiger lists the run values for each of the 24 base/out situations. Let's focus in on the 4 stats of interest:
ROB  Outs    1B    BB     SO    OUT
--- 0 0.40 0.40 -0.26 -0.27
--- 1 0.27 0.27 -0.19 -0.18
--- 2 0.13 0.13 -0.11 -0.12
x-- 0 0.73 0.66 -0.39 -0.47
x-- 1 0.48 0.41 -0.32 -0.38
x-- 2 0.27 0.23 -0.25 -0.26
-x- 0 0.70 0.40 -0.48 -0.33
-x- 1 0.70 0.25 -0.38 -0.32
-x- 2 0.74 0.13 -0.35 -0.37
--x 0 0.50 0.41 -0.46 -0.27
--x 1 0.57 0.24 -0.60 -0.22
--x 2 0.85 0.16 -0.40 -0.33
xx- 0 0.97 0.76 -0.64 -0.47
xx- 1 0.94 0.69 -0.50 -0.56
xx- 2 0.89 0.35 -0.48 -0.45
x-x 0 0.82 0.51 -0.63 -0.48
x-x 1 0.82 0.44 -0.68 -0.42
x-x 2 0.96 0.28 -0.56 -0.50
-xx 0 0.84 0.31 -0.64 -0.48
-xx 1 1.00 0.24 -0.79 -0.50
-xx 2 1.46 0.19 -0.64 -0.63
xxx 0 1.21 1.00 -0.71 -0.52
xxx 1 1.25 1.00 -0.84 -0.69
xxx 2 1.54 1.00 -0.83 -0.79

Relative to a single, a walk's value is the least with runners on 2nd and 3rd and 2 out (1.46 runs for a single and .19 runs for a walk). This makes sense, since a single scores 2 runs fairly often in that situation, while a walk scores zero. Relative to a BIP out, a K is most costly with a runner on 3B (should be 2nd & 3B, I think) and 1 out (-0.6 runs for a K compared to -0.22 runs for a BIP out). If a high strikeout, high walk, low SLG player only saw those two base-out situations, his offensive contribution would be severly limited.

Let's look at the flip side. With no one on, the run value of a walk and single has to be equal, since both result in the same thing (runner on 1st). The cost of a SO and BIP-out are equal in that situation as well (can't advance a runner that doesn't exist). A SO and BIP-out are also equal when there are 2 outs (you can't advance a runner with a ground out if the inning is over). A player with high K and BB totals would maximize his worth is he were to only bat with no one on or with 2 out.

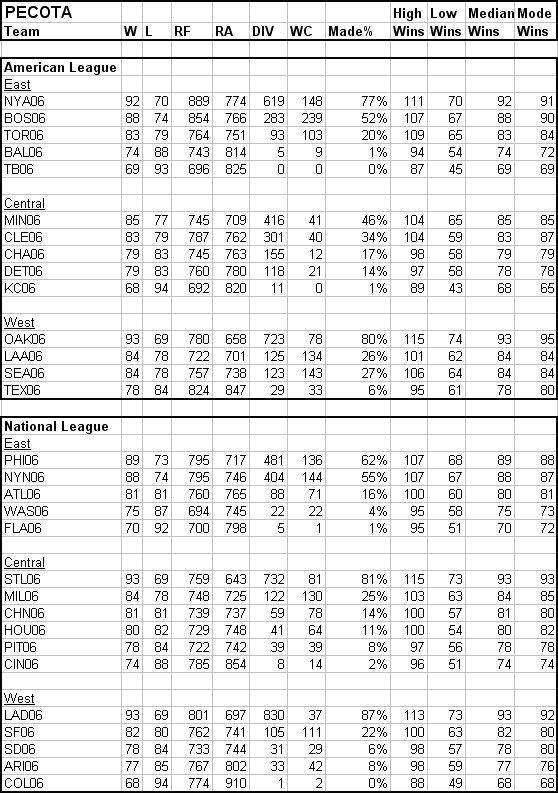
What about NL lead off hitters, though? We want to know what base/out situations an average NL lead off hitter sees most. Is it significantly different than the average batter? We know that about 20% of a leadoff hitter's PA will come with the bases empty (during his first AB of a game). Also, by following the weakest part of the lineup, a leadoff hitter will have more PA's with no one on and/or 2 out than the average batter. It would be fair to assume, then, that a lead off hitter doesn't face the average amount of each base-out situation.

To find out how atypical Clark's distribution of base/out situations were, let's find out what percentage of PAs he had with either no one on or with 2 out in 2005. For comparison, I'll also list the same numbers for Carlos Lee, who hit out of the 4 post all year:
                  Clark     Lee
Bases Empty: 72% 50%
empty and/or 2Out: 86% 73%
For 72% of Clark's PAs in 2005, a walk would have had the same run value as a single. For 86% of his PAs a strike out would have had the same cost as a normal out. I don't have the league average numbers handy but you can see that Clark's numbers are significantly different than Lee's.

On average, Lee's strike outs are more costly and his walks are less valuable than Clark's simply because of where they bat in the order. Where a batter hits in the lineup has a significant effect. If I had a player with low power and batting average and very high walk and K totals, I'd put him in the leadoff spot.

"The Book" covers this topic in great detail in their "batting (Dis)order chapter. After I read it I'll be sure to post more.

BF.net Article; Bonds and Home Run Power.

Just thought I'd link to an article I wrote for brewerfan.net:

Barry Bonds, Steroids and Home Run Power

Don't worry, I don't get on my ethical high horse about Bonds' steroid use. I'll leave that to every reporter in the United States to do that. It just focus's on changes to Bonds' home run hitting ability before and he allegedly began using steroids.

Sunday, March 12, 2006

Miller Park Open House and Changes


I attended the "Select-a-Seat" Miller Park open house today and it was a good time. We got our free Carlos Lee bobblehead doll (I already had one but owell) and then checked out the information table. They had all the season ticket info there, and the gentleman maning the table would answer whatever questions you had. They also had complementary hot dogs, soda, chips, etc...


The whole park was open to the the public so we had fun just looking around at the changes that have been or are being made. First, LED display boards now ring the entire third level:


I have no idea why they weren't on but my father had seen them earlier and said they looked pretty neat. The one change I don't like at all is the LED display that was added to the left field wall:


Seems distracting to have on the actual field. It wasn't enough to have them ring the whole park?

The most intersting change was the addition of a new picnic area just behind the right field wall. Groups can look through the chain link right field wall to watch the action. As you can see, they have a long way to go before it's finished:


We even snuck a peak inside:


They had the whole thing covered in a tarp, but I found a small tear:


I'm a little skepticle of watching the game at field height from the outfield. i can't imagine you'll be able to see the action very well. Still, it will be interesting to see Jenkins from 2 inches away as he crashes into the wall :)

One other gimmick allows picnic area fans to see the visitor bullpen through a window:


You think the drunk fans will mess with the opponent pitchers? Naaaaaaaa.

You can find the rest of the pictures I took HERE.

Friday, March 10, 2006

Baseball Salary Navigator


Fun for hours....

LINK

Did you know that Wes Helms is the Marlins 3rd highest paid player, at $800,000/year? The Marlins payroll is below $18 mil, according to these numbers. You thought the Brewers were bad!

Wednesday, March 08, 2006

Panthers Win League Championship: Go Dancing


The UW-Milwaukee mens basketball team secured the Horizon League Championship by blasting Butler last night, 87-71. In doing so, the Panthers earned an automatic big to the NCAA tournament. It will be the Panthers 3rd dance in 4 years.

Congratulations to the UWM Panthers and here's to another first round upset!

Monday, March 06, 2006

Brewers' Statistical Analyst Predicts 88 Wins

Melvin was on "The Show" on XM's MLB station today. Mevin relayed the Brewers' in-house statistical analyst's projections for the NL central. He predicts that the Cardinals and Houston won't do as well this year, although the Cardinals will still win the division. The Brewers will finish in 2nd place with 88 wins and most of the rest of the Central will finish around .500.

If the Crew wins 88 games, they'll most likely be in contention for at least the wildcard deep into the season. I don't think 88 wins would be enough for a post season birth but it could make for a very interesting September.

2.5 million in total attendance would be a piece of cake if that prediction comes true.

Thursday, March 02, 2006

"The Book" and Optimal Batting Order - Part 2

A Hardball Times article talks more about optimal batting orders, as defined in "The Book." "The Book" says:

Your three best hitters should bat somewhere in the #1, #2 and #4 slots. Your fourth- and fifth-best hitters should occupy the #3 and #5 slots. The #1 and #2 slots will have players with more walks than those in the #4 and #5 slots. From slot #6 through #9, put the players in descending order of quality.

Following those rules as best as I can (the article also mentions putting the pitcher 8th) and using PECOTA projections, I come up with this lineup for the Brewers:

BA OBP SLG OPS

1 Fielder 0.268 0.349 0.489 0.838
2 Weeks 0.267 0.361 0.462 0.823
3 Jenkins 0.272 0.347 0.479 0.826
4 Lee 0.282 0.347 0.506 0.853
5 Koskie 0.251 0.351 0.431 0.782
6 Hardy 0.264 0.342 0.418 0.760
7 Clark 0.281 0.349 0.402 0.751
8 Pitcher 0.150 0.150 0.100 0.250
9 Miller 0.250 0.320 0.390 0.710

Koskie doesn't really fit at the 5 spot, since he walks more than anyone on the whole team. Since he had the 5th highest projected OPS, I decided to there, however.

It would never happen, but it sure would be interesting to see what that one through four could do!

Wednesday, March 01, 2006

Olney and Productive Outs

After the Angels won the World Series in 2002, the interest in productive outs seemed to sky rocket. Guys like Buster Olney began endlessly talking up the value of productive outs. ESPN even started to publish a productive outs metric in 2004. That would be the only year they would update that data, however. Why? Because productive outs had a negative correlation to run scored that year. It appeared that productive outs not only didn't help, but they actually supressed scoring runs.

Fast forward to 2006. In his latest blog entry, Olney once again brings up productive outs, but his stance seems to have softened considerably. It was refreshing to see him present the subject in a balanced fashion. Here's the data he presented:

All the players in the big leagues with 25 or more productive outs:
Tadahito Iguchi, White Sox, 32
Luis Castillo, Florida 31
Omar Vizquel, S.F. 31
Coco Crisp, Clev. 29
Edgar Renteria, Boston, 28
Juan Uribe, White Sox, 27
Johnny Damon, Boston, 27
Miguel Cabrera, Florida, 27
Russ Adams, Toronto, 26
Randy Winn, Sea.-S.F. 25
Darin Erstad, Angels, 25
Jack Wilson, Pitt., 25

Top 5 Productive Out Pct., AL (Minimum 40 attempts)
Bengie Molina, L.A., .522
Juan Uribe, White Sox, .509
David DeJesus, K.C., .488
Johnny Damon, Boston, .482
Russ Adams, Tor., .456

Top 5 POP, NL (Minimum 40 attempts)
Yadier Molina, St. Louis, .500
Luis Castillo, Fla., .492
Miguel Cairo, Mets, .488
Abraham Nunez, St. Louis, .450
David Eckstein, St. Louis, .444

Top 5 National League, Total
San Francisco, 211
Atlanta, 208
St. Louis, 205
San Diego, 205
Washington, 204
Florida, 204

Top 5 American League, Total
L.A. Angels, 187
Minnesota, 184
Detroit, 184
Boston, 184
Kansas City, 183

Offenses can rack up productive outs by attempting a million sacrifices (Washington) or by simply having alot of runners on base (Boston). It's hard to muster up the energy to delve into those numbers deeper when their significance has been debunked so many times before.

The higher the run scoring environment, the more valuable an out is. While I would choose an out that advances a runner over one that doesn't, I would almost never give outs away. That's not to say that a productive out doesn't have it's place, but it should be used very sparingly, in my opinion.