Wednesday, June 27, 2007

ERA Broken Down By Starts

Below are the 2007 ERA's for the Brewer starting pitchers, broken into blocks of starts. Column one and two comprise of their first and second set of five starts. The "final column includes the balance of their starts, though June 26th (number of starts are in parenthesis):
           FIRST   SECOND      FINAL   TOTAL
Sheets 4.50 3.06 2.04(6) 3.09
Capuano 3.21 5.18 5.00(3) 4.35
Suppan 2.97 4.01 7.43(6) 4.90
Bush 6.23 6.03 3.23(5) 5.17
Vargas 2.08 4.94 5.24(5) 4.29
Probably not a good idea to formulate an opinion on a pitcher based on only a handful of starts?

Pitches Per Plate Appearance

2007 Highest P/PA, min 150 PA:
PLAYER          TEAM    TPA    P/PA
Jason Giambi NYY 179 4.43
Reggie Willits LAA 251 4.38
Troy Glaus TOR 224 4.37
Nick Swisher OAK 310 4.36
Jack Cust OAK 166 4.33
Todd Helton COL 326 4.31
Ryan Shealy KAN 189 4.31
Brandon Inge DET 278 4.31
Johnny Damon NYY 263 4.30
Casey Blake CLE 324 4.30


2007 Lowest P/PA, min 150 PA:
PLAYER          TEAM    TPA    P/PA
PLAYER TEAM TPA P/PA
Johnny Estrada MIL 255 3.00
Kevin Mench MIL 161 3.08
Miguel Olivo FLA 261 3.13
Howie Kendrick LAA 177 3.14
Corey Patterson BAL 244 3.20
Kenji Johjima SEA 241 3.20
Vladimir GuerrerLAA 326 3.21
Jay Payton BAL 215 3.21
Mike Sweeney KAN 225 3.27
Aaron Boone FLA 228 3.32

Here's a little bit about pitches per plate appearance:

Hardball Times: And Here’s the Pitch...

"That said, the players in the bottom 20% of P/PA have an average on-base plus slugging (OPS) of 719 while those in the top 20% have an OPS of 797. Since OPS correlates very well with run production, it is therefore a good proxy, and because going deep into counts forces opposing pitchers to throw more pitches and tire sooner, it's safe to say that on average, players who see more pitches end up contributing more to their teams."

Someone, let Estrada and Mench know, please.

Tuesday, June 26, 2007

Two Strike Approach

When Carlos Lee was here, he was always praised for changing his approach at the plate with 2 strikes, especially when there was a runner in scoring position. This probably isn't news to anyone but Geoff Jenkins is not a fan of that philosophy:

ACTA Sports: How well do hitters protect the plate with two strikes?

With Vlad and Cabrera making the cut, Jenkins is actually in some pretty good company, however. Of course, it's not automatically bad for a batter to keep the same approach with two strikes. What really matters is the result of the approach. Batters are putting up a combined .550 OPS with two strikes this year, so the bar isn't exactly set very high.

Wednesday, June 20, 2007

A Little Run Support Goes a Long Way

Qualified NL Pitchers, 2007

NL Qualified Starters

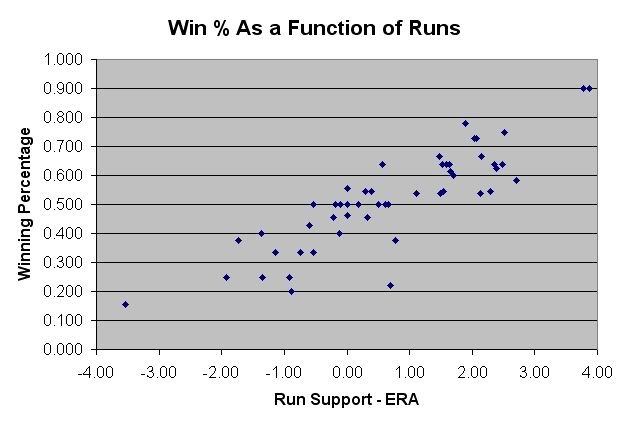
A starting pitcher's record is largely a function of the runs he gives up (whether through the fault of him or his defense) and the runs his offense scores for him.

Why was I looking at this? Sheet's victory last night pushed his record to 8-3 and I wanted to see how much his run support as helped. In a word, lots. While the Brewers offense has average 4.6 runs per game this year, Sheets has averaged 5.25 runs of support so far. Combine that with his current 3.19 ERA and you get a pitcher with an outside shot at his first 20 win year. I don't think he'll do it (the run support probably won't hold up) but as a Sheets' fan, it's nice to enjoy a little help from the offense once in awhile.

Tango's Offense Simulator

Tangotiger was nice enough to make a simple runs created simulator available to all:

The Runs Created,Run Expectancy,Run Frequency,Linear Weights Generator

Check out the link to the blog discussion on it.

Tuesday, June 19, 2007

Strength of Remaining Schedule

I was just wondering about the strength of the Brewers' remaining schedule and "Bucco Blog" was nice enough to read my mind:


NLCD Remaining Schedule Breakdown


As it stands, it looks like the Brewers have a very easy schedule remaining. When you are trying to judge team strength on 70 games, SOS can sometimes be pretty misleading, however. Still, all things considered, the NL Central looks like a two team race to me, with the Brewers pretty heavy favorites right now.

Monday, June 18, 2007

Home Stand Probabilities

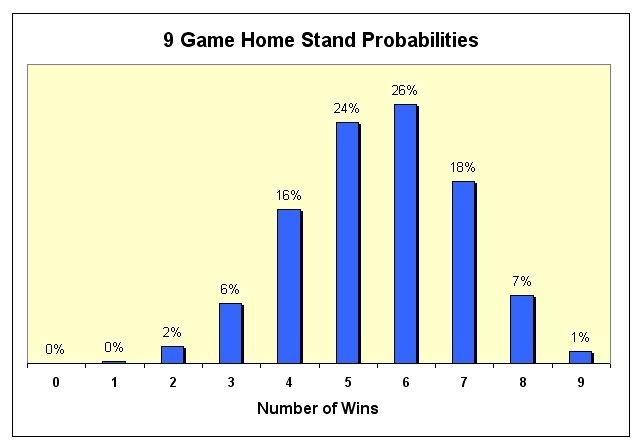
After a nice 5-4 road trip, the Brewers come home for a nine game home stand and their prospects look great on paper. To calculate my probabilities, I'll be lazy again and just use Baseball Prospectus' AEQR and AEQRA from their Adjusted Standings page:

Individual Game Odds

It's not hard to eyeball those odds and see that the average expected home stand record is about 5-4 or 6-3. Let's look at the the chances for all possible outcomes:

Record Probabilities

That works out to about a 75% chance of 5-4 or better and 50% of 6-3 or better. Time to take advantage and make the "on paper" a reality!

Thursday, June 14, 2007

Playoff Odds Calculations

A thread about the kind of projections I am addicted to:

"Inside The Book" Blog: Odd of Making the Playoffs

Someone needs to explain to me what's a reasonable way of estimating the amount of regression that should be performed.

Wednesday, June 13, 2007

What's the Cause of This Slide?

After a great 24-10 start, the Brewers have seemingly fallen apart, going 10-20 and causing Brewer fans everywhere to seriously question the talent level of the current club. Let's look at what might be causing the slide and try to determine if we should expect more of the same.

30 games, 17 on the road and 13 at home. Some very tough opponents sprinkled in there but the SOS for those 30 games was still only a hair over .500 (thanks, Texas). As a rough guess, I'd say a fair expectation (assuming the Brewers really are a 85 win team) might have been about 14 or 15 wins. They missed the mark by maybe 4 or 5 wins. Just bad luck? Let's look at the run distributions:

Photo Sharing and Video Hosting at Photobucket

The NL average RPG (runs per game) has been about 4.5 runs. It looks like the Crew's offense has been as below average as the pitching staff. The pythagorean suggests a 11-19 record but those 12 runs scored early accounts for most of the discrepancy. The Brewers have earned that 10-20 record.

This is where I was supposed to look at which players have over performing during the slump and which have under performing. But as I type this, the Brewers have just won a tough game against the Tigers on the road. Stay tuned for my next post, where I write about what factors contributed to the Brewers resurgence. :)

Friday, June 08, 2007

Brewer MVP So Far?

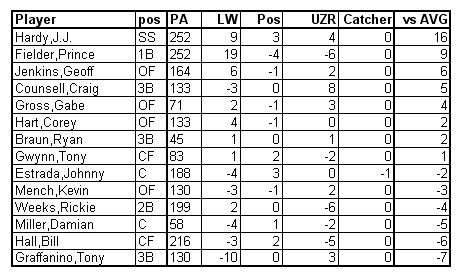
If you consider defense, Hardy has been the MVP so far:

Runs Above Average

Statistically Speaking: Why Bill Stoneman is smarter than I am

The "LWT" column shows the run value of each player's contribution at the plate ( using linear weights). The "UZR" column shows their defensive contribution. The position adjustment (a big hitting SS is more valuable than an equally gifted DH) is shown in the "Pos" column.

Finding Hardy and Fielder in the one and two spot is probably no surprise to anyone. While Prince has easily been the MVP with the bat, he's really hurt his value on the defensive side of things. The big surprise, though, is Craig Counsell being 4th on the list. It's hard to believe that a guy with a .227 BA and a .291 SLG could rank anywhere near the top but Counsell has had value in other areas. With a .353 OBP, Counsell has kept his offensive production at least reasonable by limiting his outs. His main contribution has been his SS level defense at 3B, however. 8 runs over average in 40-some games is monstrous. While he wouldn't have kept that up all year, I think it's fair to suggest that Counsell hasn't hurt the Brewers as much as many thought (yes, including me).

On the slip side, according to UZR, Weeks and Hall have really hurt their value with some shoddy defense. Halls' troubles have been pretty evident, as he's made a number of obviously bad plays. Weeks, on the other hand, is a bit of a surprise. He's limited his errors but perhaps his range isn't where it should be?

Because of the small small samples involved, it would be foolish to simply extrapolate any of these numbers but they do give you an interesting snapshot of the Brewer's season so far. My money is on Hall to make the biggest positive jump on the list. Hopefully, Sean Smith will update this in a couple months.

Thursday, June 07, 2007

9 Game Road Trip Probabilities

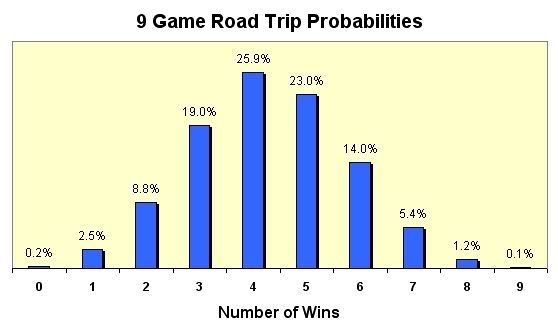
The Brewers have a nine game road trip against the Rangers, Tigers and Twins coming up and I thought I'd take a peak at their chances. I used Baseball Prospectus's "Third-Order Wins" as an estimate of each team's true talent. For instance, BP calculates that based on the Brewers raw stats and strength of schedule, they "should" have a 30.7 - 29.3 record. While 60 games isn't enough of a sample to get a very accurate gauge of a team's talent (not to mention, personnel and ability isn't static), it's a decent ballpark guess.

Here are the results:

9 Game Road Trip Probabilities

Looks like the Brewers have a decent shot of a winning road trip. Brewer fans everywhere could sure use that.

Wednesday, June 06, 2007

Dave Bush is Not A Six Inning Pitcher

It seems that every year, Brewer fans grab hold of an observation based on a small sample and than declare it as fact for the rest of the year. A recent example is the new myth that Dave Bush should be pulled at the earliest signs of trouble after the 6th inning. It's based on the fact that Bush has run into some serious trouble late in games this year. The irony is that the exact opposite has been true in years past.

From 2004-2006 (his entire ML career, prior to 07'), the deeper he went into the games, the better he got:

             BA   OBP   SLG   OPS
Inning 1-3 .275 .331 .462 .793
Inning 4-6 .250 .288 .407 .695
Inning 7-9 .199 .244 .306 .550

Bush was an absolute work horse for the Brewers in 2006. Of his 32 starts, half went for 7 or more innings, including 3 complete games. That's about as good as it gets for a #4 starting pitcher.

Unfortunately, he's run into some serious trouble in the 7th this year and fans have started to notice. But while he's given up an eye opening 1.677 OPS to batters after the 6th inning so far, that's been over a paltry 18 AB. Why should we pay attention to a sample like that, when 186 AB from the previous 3 years paints a completely different picture? The answer is, we shouldn't. The sample is simply too small to draw any meaningful conclusions from it.

It's human nature to search for patterns from the most recent events but in baseball, if you start making personnel decisions based on those observations, you are running the risk of making some serious mistakes.