Tuesday, February 28, 2006

"The Book" and Optimal Batting Order

I couldn't hold off any longer and finally ordered "The Book" Written by Tangotiger, MGL and Dolphin, I can't imagine it not being great. I'm sure I'll be writing about it's contents alot during the next few weeks.

What finally got me to order "The Book" was my curiousity over it's batting order chapter. There's been alot of talk about optimizing batting orders in saberland of late. The recent interest was ignited by some regression analysis done at "Beyond The Boxscore" that attempted to find the value of OBP and SLG by lineup position. Next thing you know, someone decides that it could be used to find optimal batting orders (and the runs created from ). A lineup generater was then written based on that assumption.

The problem is, that assumption is 100% incorrect, in my opinion. The analysis might give you insight on how to best utilize a traditional lineup (I'm skeptical of even that) but it certainly isn't going to tell you what a lineup "should" be. A much more sophisticated approach would be needed for that.

Fortunately, the The authors of "The Book" did just that. They use Markov Chains (sophisticated propabalistic mathmatics) to calculate the optimal batting order. According to a very short summary posted on Baseball Think Factory, here's what "The Book" says to do:

"Your three best hitters should bat somewhere in the 1, 2 and 4 slots. Your fourth and fifth best hitters should occupy the 3 and 5 slots. 1 and 2 guys should walk more often."


Let's comepare that to what managers did in 2005, as a group:
MLB, 2005

POS OBP SLG OPS

#1: 0.341 0.406 0.748
#2: 0.331 0.403 0.733
#3: 0.358 0.476 0.834
#4: 0.355 0.485 0.839
#5: 0.339 0.455 0.794
#6: 0.330 0.436 0.766
#7: 0.316 0.392 0.709
#8: 0.316 0.387 0.702
#9: 0.316 0.387 0.702

I always thought that teams putting a relatively weak hitter at #2 were making a mistake. It will be interesting to read "The Book" to find out how much that inefficiency (along with the rest) costs a team in terms of runs.
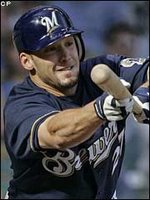
Baseball Graph's "Batted Ball" Tables

Dave Studeman of Baseballgraph.com and Hardballtimes.com came up with an interesting data table a ways back. He calls them "batted ball" tables and they summarize the batted ball types and run values for batters, pitchers or entire teams:

Batted Ball Library Index

That index gives you all the background information you'll need to understand the tables (hint: read all the linked Hardball Times articles). The index also includes links to team specific pages.

Let's take a quick look at Milwaukee's Summary batted ball table:
 
Net Runs per Ball % of Batted Balls %/OF %/PA
BFP OF LD GB OF% LD% GB% HR K BB

2002 6083 0.02 0.37 -0.12 30% 20% 47% 10% 18% 9%
2003 6270 0.08 0.36 -0.12 30% 21% 45% 14% 19% 10%
2004 6195 0.08 0.31 -0.10 31% 19% 45% 10% 21% 10%
2005 6156 0.07 0.32 -0.11 31% 22% 43% 12% 19% 10%
--------------------------------------------------------------
Avg. 6176 0.06 0.34 -0.11 31% 21% 45% 11% 20% 10%
Vs MLB 0.03 -0.02 -0.01 -1% 0% 1% 0% 3% 0%


Total Net Runs

OF LD GB IF NIP Tot R/G

2002 26.9 315.3 -235.8 -37.0 -152.3 -104.7 -0.7
2003 102.6 322.3 -238.5 -41.5 -160.1 - 28.4 -0.2
2004 98.2 250.0 -189.6 -38.8 -189.4 - 81.2 -0.5
2005 89.9 305.3 -197.8 -36.8 -147.4 - 6.4 0.0
---------------------------------------------------------
Avg. 79.4 297.9 -215.0 -38.6 -162.1 - 54.7 -0.3
Vs MLB 31.7 -29.8 - 20.4 7.0 - 48.2

There is a heck of a lot of data in these tables to digest. I suggest going through the author's example on the index page to learn how to read these things.

The Brewers sure have struck out alot the last 4 years.

Monday, February 27, 2006

Worst Active Pitchers - FIP

Out of curiousity, I looked up the worst active pitchers with atleast 200 innings, in terms of FIP:
Pitcher                     IP     K/9    BB/9    HR/9     FIP
Glynn Ryan 226.33 4.61 4.65 1.63 2.97
Brazelton Dewon 253.00 4.84 5.05 1.28 2.70
Franklin Wayne 315.33 6.08 4.62 1.57 2.63
Waechter Doug 262.67 5.21 2.95 1.82 2.54
Bell Rob 633.00 5.59 3.75 1.68 2.53
Perisho Matt 276.00 6.59 5.28 1.37 2.47
Vargas Claudio 364.67 6.07 3.75 1.65 2.46
Jarvis Kevin 752.67 5.26 3.00 1.75 2.44
Creek Doug 289.33 9.08 6.19 1.52 2.42
Douglass Sean 207.67 6.72 4.90 1.47 2.38
Rodriguez Ricardo 206.67 4.53 3.27 1.44 2.33
Gobble Jimmy 254.33 4.18 3.11 1.45 2.30
Chacon Shawn 631.33 6.06 4.60 1.27 2.25
Wood Mike 228.67 5.08 3.42 1.38 2.21
Santana Julio 470.67 5.81 4.26 1.32 2.16
May Darrell 660.67 5.64 2.89 1.68 2.16
Acevedo Jose 368.33 6.18 2.76 1.73 2.15
Obermueller Wes 256.33 4.60 3.69 1.23 2.15
Wright Jamey 1305.67 4.84 4.54 1.01 2.14
Elarton Scott 898.33 6.22 3.37 1.54 2.07

Wayne Franklin, Jamey Wright, Wes Obermueller... It's nice to know the Brewers have better options for starting pitchers these days!

On a side note, how does a guy like Kevin Jarvis and Darrell May stay in the league for so long??

WOAH SOLVDD Audio Show - Feb.

The February edition of the WOAH SOLVDD Audio Show is out. There's a nice interview with Brewer's catching prospect Angel Salome, among other goodies.

As for my contribution, I talk some about Ben Sheets, comparing his BB rate, HR rate, K rate and FIP to all other active pitchers with atleast 200 innings pitched. Here's how he did:

Sheets, Among the 344 Active Pitcher's With 200+ IP


Sheets Ave Rank
K/9: 7.6 6.7 88th
BB/9: 2.00 3.23 9th
HR/9: 1.07 1.01 194th
FIP: 0.61 1.15 36th

I'll have a post dedictaed to Sheets soon.

Friday, February 24, 2006

Perspective and Baseball

"Sheetswannabe", a poster from Brewerfan.net, started a thread about Moeller a few days ago. In that thread, he made this comment:

"I personally think he [Moeller] will be the most improved player, behind Weeks and Hardy. I'd imagine .245 avg. That would help out a lot, Millers getting older, and still reminds me of the catcher on Major league. Moeller NEEDS to step it up if we want to succeed."


While his batting average prediction may prove to be correct, I can't agree with the level of importance he places on it actually occurring. Two reasons:

1. Batting average is just a small part of the run production equation. A player can add 40 points to his batting average without significantly improving his offensive worth.

2. Backup catchers typically get a maximum of about 200 ABs. As a result, their offensive impact is usually only about 1/3 the size of a starting player. They also typically stink.

For Moeller to improve to a .245 BA in 2006 in the same amount of ABs from last year (199) , he'd need to convert 8 of his outs into singles. Doing only that, this is what his 2006 line would be:
             BA   OBP   SLG   OPS
2005: .206 .257 .367 .624
2006: .245 .294 .407 .701
Ave 05 C: .254 .313 .391 .704

Using linear weights, that has a run value of:

8 x (.1 runs/out + .47 run/single) = 4.6 runs

4.6 runs is about half a win. While that's not insignificant, there are bigger sources for potential improvement in 2006. For instance, Weeks having a breakout year would have a huge impact on improving "runs scored" from 2005. Let's say Weeks did this in the upcoming season:
   
AB BA OBP SLG OPS BRC

Brew 2B 05 625 .250 .333 .414 .748 86
Weeks 06 625 .275 .375 .475 .850 111
---
+25

Even if he only marginally surpasses his PECOTA projection of .267/.361/.462, he'll be worth about 2.5 wins over what all Brewer second basemen combined for last year. That's about a 5 times greater impact than Moeller batting .245.

I appreciate that part of Sheetswannabe's concern is that Miller's nagging injuries will give Moeller more playing time in 2006. I guess I'm confident that Miller can atleast match his 385 AB from last year. That really wasn't much to begin with.

The above calculations are only rough estimates, but they still have alot of value. Weeks has a much greater chance of positively influencing the offense this year than Moeller. Backup catchers just aren't that important, relative to a starting positional player.

Sunday, February 19, 2006

Hitting With RISP a Skill?

On the last "Talking Brewers", Powell interviewed Miller and Miller brought up hitting with runners in scoring position. He mentioned how well he had done in 2004 with Oakland in that situation and compared it to his poorer performance in 2005 with the Crew. Powell pointed out that statistically minded folks feel that any variation is basically random and hitting in the clutch isn't a distinct skill.

Miller made it clear that he felt some guys were clutch but admitted most of those guys were good hitters to begin with. He said that a good mindset was very important in that situation. While I agree, I don't think that a "good mindset" is something that makes you perform better than your average with RISP. A good mindset simply keeps you from choking in that situation.

I can certainly understand Miller's viewpoint, but most people simply don't realize how much variation in batting statistics can be explained by simple luck.

Tuesday, February 14, 2006

Dunn Signs 2 Year Deal

Dunn forgoes arbitration and signs a 2 year, $18.5 million contract, with a club option in 2008 for $13 million. Great signing for the Reds, as Dunn is one of the best hitters in the league and in his prime. THIS is when you sign a guy. For Brewer fans, the irony is that Carlos Lee will sign a better deal than this when he's a free agent after next year. If Lee puts up his usual 30 HR/100+ RBI season in 06', he'll easily get a 3 year/$30+ mil deal. I'll just be glad when it's not with the Brewers.

Let's compare the career stats of these two guys:
         AGE   BA  OBP  SLG   OPS  PA/K
Dunn 26 .248 .383 .518 .902 3.80
Lee 29 .284 .337 .488 .825 7.37

I added PA/K because that Dunn's big knock, but there's no way Lee's higher batting average and lower K rate even begins to make up for that OBP difference. This is how their outs and strikeouts compare over a theoretical 650 PA season, using their career stats:
      Outs    K
Lee 431 88
Dunn 401 171
---------------
30 -91

Dunn strikes out 91 more times but also makes 30 less outs. Considering a strikeout in an average situation is only marginally worse than a normal out, I would easily take the 30 less outs and the younger guy. I know they aren't fun to watch, but the point of a batter is to create runs and less outs drives up runs alot faster than K's drives them down.

Thursday, February 09, 2006

Clark Signed to 2 Year Deal


In a suprise move made on the eve of his arbitration hearing, Brady Clark agreed to a 2 year, $7 million deal. He will get $3.2 mil in 2006 and $3.8 mil in 2007.

Let's look at his stats from last year, along with his PECOTA projections vs. an average 2005 MLB CFer:

Brady Clark, PECOTA Projection

Year            PA  AVG  OBP  SLG  OPS
2005 (Actual) 599 .306 .372 .426 .798
2006 (Proj) 559 .286 .351 .413 .764
2007 (Proj) 510 .279 .345 .403 .748
Ave 05 MLB CF --- .272 .331 .422 .753

Brady will turn 33 in April, and BP has that age catching up with him. Still, even that conservative estimate has Clark above average next year and average in 2007. Provided his defense holds up (PMR had him as the 5th best full-time CF last year), I think it's a very good deal.

The Hardball Times put Clark's Net Win Share Value at about $5 mil last year. Even if he regresses to his PECOTA projections, he'll be worth around $3 mil/year; If he stays near his 2005 numbers he'll be a steal. It's a slight risk with a nice possible reward. Even if Melvin wants to go with a younger option for CF in 2007, Clark's trade value could still be pretty darn good.

Congratulations, Brady Clark.

EDIT: Looks like the above numbers are "adjusted". I'll have to look into that.

Wednesday, February 08, 2006

BIP Type Distribution

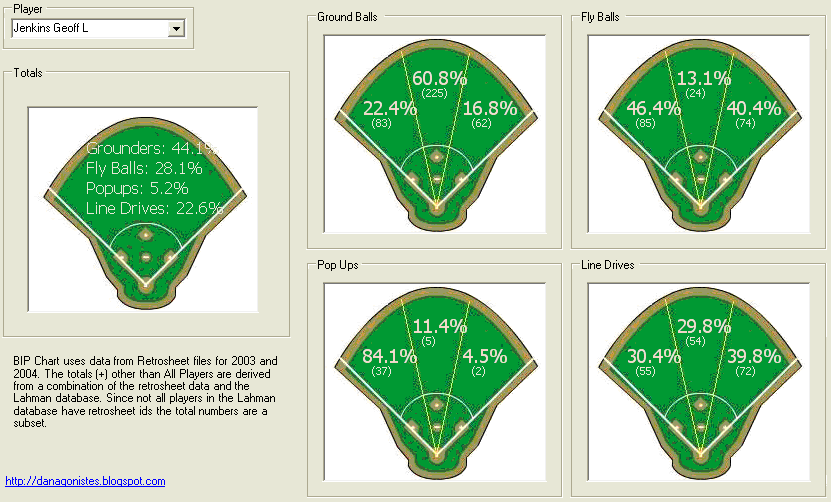
About a half a year ago, Dan Fox wrote a nice little program showing BIP type distributions from 2003 to 2004. You can search by individual players or different groups of batters (left handers, right handed power hitters, etc...). You can find the post with a link to the program HERE. Here's the program displaying Geoff jenkin's BIP distributions:


I dug it up after someone at brewerfan.net questioned whether batters typically pull grounders. Here's what I found:

2003 - 2004, Groundballs
                 Pull     CF      Opp
Right Handers 38,382 12,828 10,320
Left Handers 6,195 20,894 8,472
----------------------
44,577 33,722 18,792
----------------------
45.9% 34.6% 19.4%

Twice as many groundballs are pulled than hit the opposite way. The odd thing about it is that lefties' groundballs are pretty evenly distributed. Let's look at what fielders fielders actually make plays on the grounders, according to data in this article:

2003 - 2005, Groundballs
GB     Bats     1B    2B    3B    SS    OF   
41034 L 0.22 0.31 0.06 0.15 0.17
54460 R 0.04 0.14 0.26 0.30 0.17

Hrmmm. This data has an extra year in it but has less total ground balls. Unfortunetely, Lost is on so I'm out of time! I'll have to update this another time.

Friday, February 03, 2006

Will Jenkins' HRs Increase Next Year?

A poster going by the name of "Brewercrew5" posed this question at brewerfan.net:

"I was wondering if any of you thought that Jenk's HR totals would increase this season since they are moving the right field wall in about 8 ft."


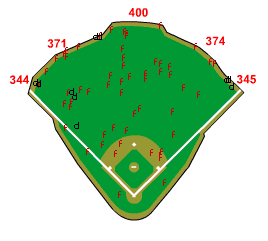
It's an interesting question and one that can be answered if prior performance can give us an insight into Jenkins' tendencies. MLB.com provides hit charts for all players, including our very own Geoff Jenkins. I looked at his last three years in Miller Park and tried to estimate how many doubles and flyouts might have been home runs with a closer right field wall. If there was a small chance it could have helped Jenkins, I gave him the benefit of the doubt. For example, here are all of Jenkins' doubles and flyouts at Miller Park in 2005:


At best, 3 doubles and 3 flyouts would have been HRs instead. Here's a summary of the last 3 years.

Geoff Jenkins, 2003-2005
       2B-HR  FO-HR
2003 2 0
2004 5 1
2005 3 3

I would estimate the short porch adding about 2 or 3 extra HRs for Jenkins next year.

Wednesday, February 01, 2006

Brewer PECOTA Projections

Baseball Prospectus's PECOTA projections are finally out. Let's see how the Brewers fare:

Positional Players:
Player                  PA    R  2B   HR  RBI   SB  CS    BA   OBP   SLG 
Braun, Ryan 403 47 27 15 61 4 2 .268 .311 .471
Cirillo, Jeff 160 17 7 2 15 2 1 .252 .334 .356
Clark, Brady 559 67 29 9 59 9 5 .281 .349 .402
Crabbe, Callix 428 46 18 1 27 12 4 .237 .318 .310
Cruz, Nelson 479 59 24 20 66 9 3 .242 .316 .446
Cruz, Enrique 450 44 22 10 46 3 2 .234 .289 .364
Escobar, Alcides 517 55 24 2 37 22 9 .248 .279 .328
Fielder, Prince 529 67 24 25 82 5 2 .268 .349 .489
Gross, Gabe 422 51 22 10 46 5 3 .260 .348 .409
Gwynn, Anthony 451 47 18 1 29 15 6 .235 .312 .301
Hall, Bill 521 67 29 15 60 15 6 .268 .324 .439
Hardy, JJ 486 54 25 13 57 1 1 .264 .342 .418
Hart, Corey 526 74 30 19 68 20 7 .272 .347 .479
Iribarren, Hernan 516 61 21 3 38 22 8 .260 .319 .355
Jenkins, Geoff 590 70 32 24 86 1 1 .272 .347 .479
Koskie, Corey 410 48 19 13 51 5 2 .251 .351 .431
Krynzel, David 437 56 21 9 40 17 7 .245 .312 .400
Lee, Carlos 640 87 37 29 100 11 4 .282 .347 .506
Miller, Damian 280 25 14 7 31 0 0 .250 .320 .390
Moeller, Chad 191 16 9 5 20 0 0 .225 .283 .364
Moss, Steve 469 53 22 9 45 10 5 .236 .303 .368
Nelson, Brad 497 52 25 12 55 4 3 .244 .313 .389
Weeks, Rickie 562 75 31 18 68 14 6 .267 .361 .462

Pitchers:
Player               W  L  SV  G  GS  IP     H    BB  Ks   H   GB%  BABIP  WHIP  ERA
Adams, Michael 2 2 2 44 1 46.3 44 20 39 5 .45 .289 1.38 4.23
Bennett, Jeff 4 5 2 57 4 86.0 86 39 61 12 .47 .282 1.46 4.78
Bush, David 9 9 0 31 26 156.3 164 40 101 20 .46 .289 1.30 4.22
Capellan, Jose 3 5 1 47 6 71.0 72 35 53 9 .42 .293 1.51 5.06
Capuano, Chris 11 11 0 31 31 195.0 189 74 146 26 .42 .280 1.35 4.20
Costello, Ryan 3 6 0 29 11 76.7 92 46 45 14 .49 .310 1.80 6.75
Davis, Kane 2 3 2 53 1 49.3 48 27 43 6 .45 .295 1.52 4.81
Davis, Doug 12 11 0 32 32 202.7 189 78 160 21 .47 .282 1.32 3.84
De La Rosa, Jorge 2 3 1 40 2 50.0 48 31 45 4 .48 .307 1.59 4.60
De Maria, Chris 2 3 1 30 3 53.0 56 19 41 11 .41 .282 1.41 5.04
Dillard, Timothy 8 10 0 27 25 150.0 164 49 80 18 .53 .295 1.42 4.95
Eveland, Dana 6 8 1 45 17 111.3 118 48 78 11 .54 .305 1.48 4.77
Fernandez, Jared 4 7 0 24 13 85.3 101 35 41 14 .47 .298 1.59 5.89
Gallardo, Yovani 6 9 0 25 21 120.0 119 66 86 15 .51 .288 1.54 5.11
Helling, Rick 5 7 0 34 17 100.0 106 42 64 17 .39 .284 1.48 5.15
Hendrickson, Ben 6 9 1 45 16 127.7 136 52 80 16 .51 .293 1.47 4.94
Jackson, Zach 7 10 0 28 24 141.0 155 54 86 18 .50 .300 1.48 5.17
Kolb, Dan 3 3 4 53 0 56.0 63 25 33 5 .54 .311 1.57 4.79
Lehr, Justin 3 4 1 46 5 69.7 75 30 44 8 .50 .299 1.52 4.98
Ohka, Tom 9 10 0 31 26 164.0 175 44 92 22 .44 .285 1.34 4.33
Parra, Manny 8 10 0 29 23 143.0 151 47 92 17 .54 .294 1.38 4.63
Sarfate, Dennis 4 8 0 28 17 101.7 110 66 69 20 .40 .287 1.73 6.29
Sheets, Ben 14 8 0 30 30 203.7 183 37 174 23 .43 .274 1.08 3.22
Turnbow, Derrick 3 5 22 58 0 59.7 54 29 50 6 .48 .280 1.38 3.82
Villanueva, Carlos 6 9 0 26 21 124.0 126 56 92 26 .38 .273 1.47 5.27
Wise, Matt 3 3 3 49 0 61.0 55 23 49 7 .42 .271 1.28 4.01
Wow, it sure looks like the Brewers could have a nice 2006 season. I'll dig deeper into these numbers in the coming days.

Here'sthe PECOTA thread over at brewerfan.net:

2006 PECOTA Discussion