Friday, April 28, 2006

Brewers Defense Has Been Good So Far?

The Brewers currently have the 5th best DER (defense efficieny ratio) in the majors but what does that really tell us? In this Hardball Times article, Dave Studeman tries to break down the contribution to DER from pitching and fielding by looking at ball-in-play types. If pitchers are giving up fewer line drives than expected, than they would get the credit for allowing easier balls to field, for instance. He also broke down the fielding contribution in terms of grounders and flyballs:

Team         Pit     Fld            Grnd     Air
STL -7.1 24.9 22.2 2.7
CHN 6.5 21.6 7.5 14.1
DET 6.4 16.9 21.9 -5.0
SF -6.3 13.2 6.6 6.7
MIL 5.0 10.0 11.8 -1.8
It's nice to see that grounders have been converted into outs so efficiently so far. Let's hope the Crew can keep that up.

Brewer's Pythagorean Record, 4/27

Still a very nice Pythagorean record for the Crew, through 22 games:


The pitching has been especially "unlucky", having given up 14 more runs than predicted by BaseRuns.

Sunday, April 23, 2006

LOB and Fox Sports Net

EDIT: This post has been updated with new graphs

Fox Sports Net has decided to add LOB numbers next to the run/hit/error chart shown at the end of each half inning. What is the significance of these numbers? Is it really bad to have high LOB numbers? Let's look at those numbers in relation to a team's OBP for the 30 MLB through April 23:


It appears that a significant portion of LOB is simply determined by the number of runners a team has total. What about LOB relative to runs scored?


While that correlation isn't significant, one can certainly eyeball the general trend. I don't have the data handy, but If I used a whole year's worth of data, I think you'd see the correlation be higher.

These two graphs can be used to sum this whole thing up:

More base runners = more runs = more LOB

Teams that generally leave a lot of men on are going to usually score a lot of runs. While there will be individual games that buck that tendency, overall, a high LOB is a good sign. I say, keep the runners left on base coming! :)

Friday, April 21, 2006

I hate Win Probability Charts!

OK, I really don't hate win probability charts but they are sure are depressing to look at when your favorite team blows a huge lead. Here's the win probability chart for yesterday's Brewer game against the Reds (thank you, fangraphs.com!):


They went from about a 90% chance of winning (up by 4 in the bottom of the 3rd, 2 on and 2 out) to about a 98% chance of losing (down 10 in the top of the 6th, 2 out) in the span of 3 innings. Lucky for me, I was in attendance and able to watch them unravel first hand!

Let's look at the lagers in the WPA category:

T Ohka -32.1 %
M Adams -28.3 %
J Lehr -13.7 %
C Lee -7.9 %

This illustrates a limitation of WPA as it's constructed here. It makes no consideration for good or bad fielding and instead gives the pitcher all the credit or blame. For instance, in the third, Carlos Lee should probably have made a fairly easy catch of a blooper in medium left. Instead, he pulled up just short, resulting in the ball bouncing first off the ground and then off his glove. Instead of an out, a runner scored and the batter ended up at third. At least some of the win probability lost should be credited to Lee instead of Ohka but exactly how to do that is a little subjective. How can we quantify it?

To separate fielding from pitching in WP, you could use one of the more advanced PBP-based defensive metrics to allocate responsibility between fielder and pitcher on each play. Defensive metrics (like PMR) spit out the probability of a defender making a play, which could be used to divvy up the responsibility of a good or bad play. For instance, if the WPA for a particular double allowed was -12% and the average defender is found to make that play 50% of the time, -6% of the WPA could be credited to the defender and -6% to the pitcher. Throw in some responsibility to the defender for base advancements and you'd be all set.

I'm sure it's just a matter of time...

Wednesday, April 19, 2006

Win Probability Charts

Finally, a web site is going to publish win probability graphs for every game played, daily. As the name implies, the graphs plot the percent chance of each team winning after every PA of a particular game. The site also sums up the win probability (WPA) added for each player during the game. The site is fangraphs.com and the exact link can be found below:

Fangraphs Win Probability Page

For a more detailed description of Win Probability, check out this Hardball Times article:

The One About Win Probability

In this article from HBT, Dave Studeman warns not put TOO much weight on WPA and I agree. Within the context of a single game, a HR hit in the 9th in a tie game is about 4 times more valuable than one hit in the first. Does that mean we should give 4 times the credit to the player for hitting the 9th inning HR? I guess it depends on what that "credit" is supposed to represent. I see WPA as a measure of impact a player has on a game more than a measure of actual ability. People inclined to believe in clutch hitting and hitters would strongly disagree. I think we all can agree that they are very interesting to look at, however.

From the comment section:

but what is the point of these things?

Let me explain in a little more detail. It shows you two things:

1. The probability of either team winning at any point in the game. This is the "win probability" (WP).

2. The amount the probability changes for each baseball event (walk, single, HR, etc...). This is the "win probability added" (WPA).

Like I tried to briefly explain above, not all baseball events have equal value with regard to their impact on what team end up winning. Let's look at two very different situations:

1. A solo shot in the 9th while down 10-0:

The win probability added for situation 1 is practically zero; They had almost no chance of winning before or after the HR. We would say that the WPA given to the player who hit it was basically 0.

2. A grand slam in the 9th with 2 out, home team down 3-0.

For situation 2, the home team had a very small chance of winning before the HR, and 100% chance of winning after (walk off HR). As a result, the WPA of that HR was huge. We can use the "Win Expectancy Finder" link on my blog to estimate the WPA for that HR. The finder shows the number of times teams won in different situations from 1979-1990 and 2000-2004. In the 149 games where situation 2 occurred, the team behind won only 9.4% of the time. The WPA for hitting that grand slam would be:

100% - 9.4% = 90.6%

That's the highest value a single event can have. The sample is still pretty small and the actual run environment isn’t being considered, so there's definitely some uncertainty there. Still it's still a nice ballpark estimate and you can find some suprising situations if you look hard enough.

Monday, April 17, 2006

Brewer's Pythagorean Record, 4/17

Just a quick update the the Crew's BaseRuns Pythagorean Record:


Based on their actual runs scored and allowed, they should have a record of 5.5-6.5. According to BaseRuns however, they scored less runs and given up more runs than would be expected. Using the expected runs scored/against, they have a pythagorean record of 7.1-4.9. So they've been both lucky and unlucky so far and the end result is that their current record pretty much reflects their actual performance.

UZR Explained

In my studies of defensive metrics, UZR was generally described as the most advanced defensive metric that has been created so far. The metric's designer, Mitchel Lichtman (aka MGL), gave a nice interview at Baseball Digest explaining his system in pretty good detail:

UZR and Beyond! An Interview with Mitchel Lichtman

I guess Dewan's recently published book, "The Fielding Bible" has prompted Lichtman to try and get a little publicity for the research he's done on defensive metrics (MGL was not mentioned in Dewan's book, despite the similarities in their systems). If that means more information on UZR, sounds good to me. Maybe he'll even publish a "Best of 2005"...

Check out this post for more information on defensive metrics, including additional information on UZR.

Tuesday, April 11, 2006

Worst Brewers Since 1993

This thread at brewerfan.net motivated me to find the worst seasons since 1993 for a brewer who was lucky enough to aquire atleast 350 AB that year. The list includes anyone who fit the above criteria and had an OPS below .750:
Name                 year    G   AB  AVG  OBP  SLG  OPS
Clayton Royce 2003 146 483 .228 .301 .333 .634
Listach Pat 1993 98 356 .244 .319 .317 .637
Grissom Marquis 2000 146 595 .244 .288 .351 .640
Counsell Craig 2004 140 473 .241 .330 .315 .645
Hall Bill 2004 126 390 .238 .276 .374 .650
Williams Gerald 1997 155 566 .253 .282 .369 .651
Podsednik Scott 2004 154 640 .244 .313 .364 .677
Ward Turner 1994 102 367 .232 .328 .357 .685
Grissom Marquis 1998 142 542 .271 .304 .382 .685
Hernandez Jose 2000 124 446 .244 .315 .372 .687
Reimer Kevin 1993 125 437 .249 .303 .394 .696
Loretta Mark 2001 102 384 .289 .346 .352 .698
Sanchez Alex 2002 112 394 .289 .343 .358 .701
Reed Jody 1994 108 399 .271 .362 .341 .703
Yount Robin 1993 127 454 .258 .326 .379 .705
Young Eric 2002 138 496 .280 .338 .369 .707
Surhoff B.J. 1993 148 552 .274 .318 .391 .709
Hardy J.J. 2005 124 372 .247 .327 .384 .711
Valentin Jose 1998 151 428 .224 .323 .393 .716
Valentin Jose 1997 136 494 .253 .310 .407 .717
Hayes Charlie 2000 121 370 .251 .348 .370 .718
Perez Eddie 2003 107 350 .271 .304 .420 .724
Vaughn Greg 1995 108 392 .224 .317 .408 .725
Weeks Rickie 2005 96 360 .239 .333 .394 .727
Hammonds Jeffrey 2002 128 448 .257 .332 .397 .729
Vina Fernando 1996 140 554 .283 .342 .392 .733
Grissom Marquis 1999 154 603 .267 .320 .415 .734
Hamilton Darryl 1995 112 398 .271 .350 .389 .740
Loretta Mark 1997 132 418 .287 .354 .388 .742
Hernandez Jose 2001 152 542 .249 .300 .443 .743
Belliard Ron 2000 152 571 .263 .354 .389 .743
Loretta Mark 1999 153 587 .290 .354 .390 .744
So many outfielders! I don't get it.

Brewer's Pythagorean Record, 4/11

Because it's never too early to use a small sample, I thought I'd see how many wins the Brewers should have based on their base stats. I used BaseRuns to calculate expected "runs scored" and "runs against". I used Pythagopat (RPG^.287) to calculate the expected record. I'll put the actual values in parenthesis, for reference:

Games = 7
RS= 32 (27)
RA= 22 (27)
Record = 4.6-2.4 (5-2)

The Brewers have been unlucky in terms of scoring and giving up runs, but lucky with regard to their actual record.

Thursday, April 06, 2006

Park Factors - 2005

Just thought I'd post the most recent park factors on here for easy reference. I got them from USPatiot's website HERE. I like to use his factors because they are regressed.
TEAM   YRS Run PF HR PF
ARI 5 1.05 1.06
ATL 5 1.00 0.99
BAL 5 0.97 1.01
BOS 5 1.02 0.97
CHA 5 1.02 1.13
CHN 5 1.00 1.04
CIN 3 0.99 1.06
CLE 5 0.98 0.96
COL 5 1.15 1.14
DET 5 0.97 0.93
FLA 5 0.96 0.93
HOU 5 1.02 1.04
KC 2 0.98 0.91
LA 5 0.94 1.01
LAA 5 0.98 0.97
MIL 5 1.00 1.04
MIN 5 1.01 0.95
NYA 5 0.99 1.03
NYN 5 0.97 0.95
OAK 5 0.99 1.01
PHI 2 1.03 1.07
PIT 5 1.00 0.95
SD 2 0.94 0.91
SEA 5 0.95 0.96
SF 5 0.97 0.89
STL 5 0.98 0.96
TB 5 0.99 0.96
TEX 5 1.06 1.07
TOR 6 1.03 1.05
WAS 1 0.96 0.94
So, Miller Park is a neutral offensive park but gives up 4% more HRs than average.

Tuesday, April 04, 2006

Rick Helling and HR Rates

In limited work last year, Helling put up an unexpected 2.39 ERA while filling in for an injured Ben Sheets. Could the 35 year old be experiencing a late career resurgence? Let's dig into the numbers:

Rick Helling, 2005
IP:     49.0
ERA: 2.39
FIP: 3.04
xFIP: 4.74
LOB%: 81.9%
For an explanation of those metrics see this post.

That 81.9% LOB% is simply not sustainable. A pitcher would have to carry about a 1.25 ERA to justify such a low LOB%. Helling's xFIP shows that he got extremely lucky with his HRs last year. How lucky? Here's what his HR/FB% has been in the last 3 years he's pitched:
YEAR   HR/FB%
2002 12.1%
2003 15.0%
2005 2.9%
-------------
Career 10.7%
The NL average last year was 12%. His 2005 HR/FB% was flukishly good. As hardballtimes.com says, "Research has shown that about 11% to 12% of outfield flies are hit for home runs. For pitchers, significant variations from 11% are probably the result of "luck...". But his career HR/FB% suggests he should still have a pretty decent HR/IP rate (he doesn't). It turns out that the problem isn't his HR/FB%, but rather his GB/FB ratio.

To illustrate this, let's compare Helling to a list of players with some of the best HR/9 numbers in recent years:
                HR/9   HR/FB   GB/FB
M. Rivera .47 5.8% 1.51
Kevin Brown .57 9.3% 2.62
Greg Maddux .61 9.4% 2.37
Roger Clemens .66 9.3% 1.45
Tom Glavine .68 7.4% 1.45
Pedro Martinez .69 8.1% 1.09
Rick Helling 1.45 10.7% 0.67
Most guys, like Kevin Brown or Greg Maddux, sustain a low HR/9 by being extreme ground ball pitchers. Rivera is a freak of nature. His HR/FB% of 5.8% blows everyone else out of the water. I'd be tempted to guess that that's the lowest HR/FB% of any pitcher who's accumulated any substantial amount of innings. Helling is such an extreme fly ball pitcher that he could never have good HR numbers. His GB/FB rate is just too low.

Using his career average HR/FB, he "should" have given up 8 HRs instead of his actual 2 in 2005. Those 6 HRs saved were worth about 8 runs and 1.4 points off his ERA. That would still have given him a decent 3.9 ERA, but having faced only 199 batters in 2005, I'd be skeptical of drawing any conclusions from his 2005 stats. Claiming that Helling's 2.9 HR/FB% and 2.39 ERA wasn't a fluke is like saying a career pinch hitter batting .425 in 135 ABs wasn't a fluke. Crazy numbers can fall out of small samples.

Monday, April 03, 2006

2006 Stat-Based Brewer Player Predictions

With the start of the Brewer's 2006 season only hours away, I thought it would be interesting to post some of my Brewer player predictions I've made using several of the more advanced statistical metrics out there. You can find some discussion of these predictions at brewerfan.net here. I also included some of this information in the March edition of the WOAH SOLVDD Brewerfan.net audio show.

PITCHERS

Metric Toolbox:

FIP: Fielding Independent Pitching tries cut out the effects of defense and luck from a pitcher’s ERA. Equation is:


xFIP: Similar to FIP except HR is normalized using the pitcher’s FB rate and adjusted for home park.

BABIP: Batting Average of Balls in Play; The number of batted balls that safely falls in for a hit (not including home runs). Much of the variance in a pitcher’s BABIP is a result of the defense behind him and luck.

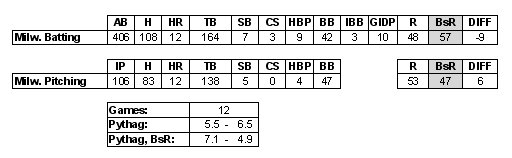
LOB%: Percentage of batters a pitcher leaves on base.

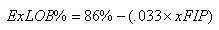
ExLOB%: Expected LOB%, based on xFIP. The exact equation is:


Derrick Turnbow
Prediction: ERA of 3.25 in 2006
2005 Stats:
ERA: 1.74
FIP: 3.18
xFIP: 3.40
BABIP: .259
LOB%: 88.1%
ExLOB%: 74.8%

Notes: Turnbow's BABIP was a little low (compared to team BABIP of about .300) but his nice slider might be the reason why. His LOB% from 2005 is unsustainable, however. He Would have had about a 3.0 ERA with his expected LOB%.

Dave Bush
Prediction: Will be a solid #4/#5 pitcher

Bush has a slightly below average K rate but, like Sheets, has a very low walk rate. Out of the 344 active pitchers with at least 200 innings pitched, Bush has the 16th lowest walk rate, at 2.08 BB/9. For comparison, Sheets is ranked 9th at 2.0 BB/9.
2005 Stats:
ERA: 4.49
FIP: 4.79
xFIP: 4.71

Notes: Last year’s FIP has an NL equivalent of about 4.40. Has a 4.15 ERA in 2 seasons in the American league (NL equivalent of 3.75). Only 26, so has a lot of time to improve.

Chris Capuano
Prediction: ERA of 4.25 in 2006
2005 Stats:
ERA: 3.99
FIP: 4.65
xFIP: 4.69
LOB%: 77.3%
exLOB%: 70.5%

Notes:Capuano improved his HR rate from 2004 (to league average) but his K/BB was actually worse. Furthermore his 18-12 record last year was primarily a result of great run support and good luck.

Capuano had the 8th highest LOB% among qualified pitchers but did have his pickoffs to help raise that number. Adjusting for his pickoffs, Capuano's LOB% becomes 72.9%. That's still 2.5% above league average, which translates into about 6 extra earned runs and an ERA of 4.23. That's about where I see him for 2006, along with a .500 win/loss record.

In Capuano's defense, he trailed off towards the end of the year, and a heavy workload may have been the culprit. While his K rate increased (scroll down a bit), so did his walk and HR rate (primarily because he was giving up more fly balls). 219 innings may have simply been 40 innings too many him last year. With a healthy Sheets, Capuano may see his innings reduced, which might allow his numbers stay strong through September.


HITTERS

Metric Toolbox:

prOPS: Predicted OPS tries to cut through the luck of a batter’s OPS; Uses 6 main factors:

K/PA, BB/PA, HBP/PA, HR/AB, GB/FB, LD%

Bill Hall
Prediction: .800 OPS

2005 Stats
OPS: .837
prOPS : .753

Notes: As I’ve pointed out before, Hall had the 4th highest prOPS over performance in 05’ and the 13th highest since 02’. Most if the difference was from the 60 point difference between his SLG and prSLG

Why be optimistic about Hall at all?

Hall’s approach looked much improved in 2005. He seemed more patient and selective at the plate. This seems to be supported by his pitches/PA numbers
Year    Pitches/PA
2004: 3.80
2005: 4.16

3.8 pitches/PA is above average; 4.16 is crazy patient. He also reduced his strikeouts while increasing his walk rate slightly. Furthermore, at only 26 years and with last year being the first time Hall has had any consistent playing time in majors, it would be unfair to not have some optimism for Hall

Geoff Jenkins
Prediction: Will continue to be valuable defensively

"Fielding Bible" by John Dewan has the Brewers having given up the most singles in front of the RF in 05', yet has Geoff Jenkins ranked as the best RFer in the NL last year. Perhaps Jenkins playing deep saves a lot of extra base hits?

• Dave Pinto of Baseballmusings.com created a defensive metric called PMR. Jenkins saved 6 runs over average last year, according to it.

• One of the highest hold% in last 3 years.

• Has thrown out 5 runners at home in the last 3 years. Again, he was one of the best in the league at doing so.

J.J Hardy
Prediction: Will have a break out year

OPS: .711
prOPS: .748

Second Half: Normally its statistical folly to ignore bad parts of a player’s season, but Hardy is a different matter. After being benched for 4 games in late May, Hardy completely changed his approach at the plate. He decided to be more aggressive, like he was in the minors. The change was dramatic:


Before May 24th, he had an excellent contact rate and walk rate, but his power was non-existent. After changing his approach, his contact and walk rate lowered but his power numbers increased dramatically. These changes can be further illustrated by tracking his BIP types as the year progressed (complements of fangraphs.com)

From fangraphs.com
From fangraphs.com

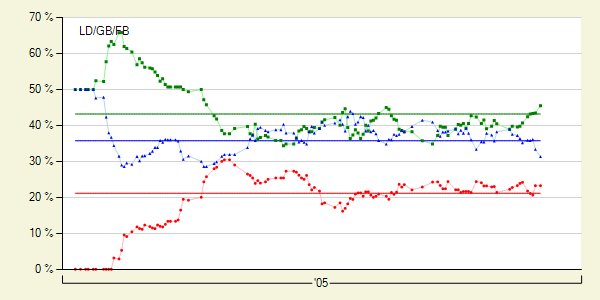
The increase in power was no fluke. More fly balls and more line drives equal more power. While Hardy had to concede less contact with his more aggressive approach, he more than made up for it in just about every other area. If Hardy can continue in 2006 where he left off in 2005, he's going to have a phenomenal year.