Monday, July 31, 2006

Jenkins Being Aggressively Shopped?

I've been told by a little birdie that Melvin is aggressively trying to trade Jenkins before the trade deadline. Considering we are 5 hours away from it, he better hurry up. 620 AM just reported about rumors of Jenkins to Boston, so this may be more than just hopeful thinking. Jenkins takes way more flak than he deserves (mostly because of his free swinging ways) but the fact remains that he’s had a very poor year and is still owed $8 million next year. Couple that with Corey Hart being a worthy successor and it’s no surprise Melvin would be trying to unload Jenkins.

Why would Boston want Jenkins? Trot Nixon strained his biceps on Sunday and could be out for some time. Despite poor overall numbers, Jenkins has still done just fine against righties this year:
            AB   BA  OBP  SLG  OPS
vs. Left 82 .122 .247 .183 .430
vs. Right 288 .295 .357 .455 .812
Total 370 .257 .332 .395 .726
Even if Jenkins didn’t revert back to his career numbers, he would still be OK in a platoon. That probably wouldn’t be worth $8 mil to anyone but for a team willing to roll the dice, (and have the pockets to do it) Jenkins might be a nice gamble. With Boston fighting to stay atop the AL East, they may be willing to give it a shot.

Friday, July 28, 2006

Possible Lee Trade

Lee and a throw-in for 3 major leaguers and a low prospect? Might even go down before the game tonight. I guess we'll see...

EDIT: OK, my "source" was correct and beat the national media on the story by about 30 minutes. Lee and Nelson Cruz for Mench, Laynce Nix, Fransico Cordero and an A ball pitcher.

He says more moves on the way.....

Read about the trade HERE.

Tuesday, July 25, 2006

Team Contact Percentage

A request was made at brewerfan.net to look at teams' contact rate to runs scored. I had looked at this at the individual level a few months a ago but I'm going to use a different definition of "contact percentage" this time. Last time I looked BIP per PA, which unfairly penalizes players/teams that walk a alot. Instead, I'll treat walks, HBP and SH as a neutral even and use this for contact percent:

CONT% = (AB + SF - K)/AB

For 2006 so far:
TEAM           CONT%   R/GM
Chicago Sox 82.5% 5.66
NY Yankees 83.2% 5.56
Cleveland 81.0% 5.52
Boston 83.0% 5.51
Toronto 85.7% 5.39
Atlanta 79.4% 5.39
NY Mets 81.4% 5.37
Detroit 80.2% 5.25
St. Louis 85.3% 5.01
Minnesota 85.4% 5.01
Cincinnati 80.1% 5.01
Texas 81.9% 4.96
Arizona 84.4% 4.95
Philadelphia 79.4% 4.95
LA Dodgers 83.9% 4.94
Baltimore 85.4% 4.83
Seattle 84.2% 4.79
LA Angels 84.2% 4.75
San Francisco 85.2% 4.75
Colorado 81.1% 4.74
Milwaukee 78.3% 4.72
Florida 77.4% 4.64
San Diego 81.0% 4.61
Washington 81.0% 4.60
Pittsburgh 80.6% 4.55
Kansas City 82.4% 4.52
Houston 81.7% 4.52
Oakland 82.5% 4.45
Tampa Bay 80.5% 4.33
Chicago Cubs 84.7% 4.12
So, while the Brewers have the second worst CONT%, there are 9 teams that scored less runs per game than them (including the team with the worst contact percentage).

To get a clearer picture of how contact percentage might affect runs scored, let's see how well they coorelate to each other:


There's simply no simple, statistical connection between the two. Of course that just tells us two things that we already know:

1. Most players who strikeout a lot make up for it in other ways. If they didn't they wouldn't be in the league.

2. In the long run, a strikeout realy isn't much worse than any other kind of out.

Brewer RBI Opportunities

Let's look at the RBI opportunities for some of the Brewer big boppers:
          PA   R1  R2  R3  ROB  OBI  OBI%  RISP%
Lee 427 137 97 58 292 53 18.1 53.1
Jenkins 400 132 103 35 270 44 16.2 51.1
Fielder 405 129 86 43 258 34 13.1 50.0
Hall 363 137 82 34 253 30 11.8 45.8

R1: # runners at 1B during their PAs
R2: # runners at 2B during their PAs
R2: # runners at 3B during their PAs
ROB: Total # of runners on base (sum of the above 3)
OBI: Number of base runners scored (RBI - HR)
OBI%: % of base runners scored
RISP%: % of ROB in scoring position ((R2+R3)/ROB)

Hall has had the least number of runners on base and also had the poorest quality of RBI opportunities. Lee has had the most and best. It's no real suprise that the players with a higher RISP% also have the higher OBI%.

Monday, July 24, 2006

Series Win Probabilities - PIT @ MIL


Three blown saves by Turnbow turned an impressive 6-3 road trip to a depressing 3-6 disappointment. My beloved Brewers currently sit at 47 – 52 and 5 games back in the wild card standings. Even finishing with a winning record will prove to be a challenge at this point. Crew will have to finish the season 35 – 28 in order to get that 82nd win and at least psychologically build onto last year’s modest success.


The Brewers need a sweep and Davis, Sheets and Capuano will be the ones who will have to do it. My probability calculations give them about a one in five chance of doing it, but you have to believe that the big three ups the odds a bit. I’ll be attending Tuesday to see Ben’s return, so that has to be good for at least an extra 1% chance.

Requesting a sweep is never a good idea but desperate times call for desperate measures!

Friday, July 21, 2006

Series Win Probabilities - MIL @ CIN


With the Brewer playoff chances slipping away, this could be a pivotal series, one way or the other. It could even decide Carlo's Lee's fate.

Tuesday, July 18, 2006

Wildcard Standings


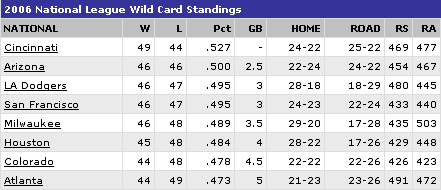
A Brewer win and a Reds' loss puts the Brewers in 3rd place in the wildcard standings, 2.5 games back. It's still a long shot but as a Brewer fan, I'll take it.

Tomo Ohka is making his first start since a shoulder injury in May placed him on the DL. Hopefully he can get right back in the groove of things. The Brewers certainly need him to...

Series Win Probabilities - MIL @ SF

Monday, July 17, 2006

Bill Hall Has Less-Crazy Splits

I just wanted to revisit Bill Hall's lefty/righty splits to see if they had started to sort themselves out. I showed in a previous post that Hall's lefty/righty splits were so extreme at the time that an adjustment should have been expected. Let's compare his splits from then to now:

JUNE 27
AB AVG OBP SLG OPS
vs. Left 54 .389 .469 .833 1.302
vs. Right 193 .238 .277 .492 .769
---------------------------------------
247 .271 .322 .567 .889


JULY 16
AB BA OBP SLG OPS
vs. Left 61 .344 .423 .738 1.161
vs. Right 243 .243 .279 .486 .765
---------------------------------------
304 .263 .310 .536 .846

While his stats against righties have remained pretty constant, he went 0-6 against lefties. When you are sporting a 1.302 OPS against lefties, it doesn't take many ABs to lower it considerably. While there’s still a significant difference between his splits, the gap appears to be closing.

What's surprising is, after an insane start, Hall's 2006 numbers are now actually worse than his breakout 2005 stats:

        AB    BA   OBP   SLG   OPS
2005 501 .291 .342 .495 .837
2006 304 .263 .310 .536 .846

While Hall has added some power in 2006, he hasn't learned to walk more yet. As a result, as his batting average goes, so goes his OBP. Unless he can get his BA over .280 this year, he's not going to be able to have even a mediocre OBP. As a SS you can live with a low OBP. As a 3B or CF a .310 OBP is a lot harder to ignore. Hall has plenty of time to rebound but if he doesn’t, Melvin is going to have some hard decisions to make in the off season.

Friday, July 14, 2006

Brewer Batters Midseason Glance - Projection vs. Actual

I thought it would be interesting to take a look back at those PECOTA projections and see how the Brewer batters have been doing with respect to their best-guess expectations. Projected ABs are based on my best pre-season guesses for playing time (making sure total season team PAs agreed with what would be expected from their team OBP). Here you go:
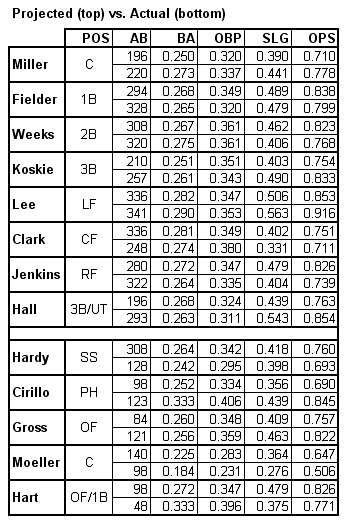


It looks like some have significantly over performed (Miller, Lee, Koskie, Hall) while others have been a major disappointment so far(Jenkins, Weeks, Hardy stand out). What is the end result? Well, if we throw in some pitcher PAs (I assumed the same performance as last year), we can project their overall expected team stats, including projected runs per game (using Basic Runs Created). Let's do that and compare the result to the actual current team stats:


Higher BA than expected? Check.
Higher OBP? Check.
Higher SLG? Check.
Higher RPG? Nope!

What the hell!? Unfortunately, while the raw stats have been better than expected, the end result is not so rosy. Basic RC estimates that the Brewers should have averaged 5.00 RPG over their first 90 games. BaseRuns puts it at 4.82 RPG. Even the more conservative of the two says the Crew scored 23 less runs than expected. In terms of RPG, let's look at where the Brewers should be ranked(using BsR) and actually do rank in the NL:
               RPG
LA Dodgers 5.31
NY Mets 5.31
Cincinnati 5.08
St. Louis 5.03
Atlanta 4.94
Arizona 4.88
Phili 4.83
Mil (Proj.) 4.82
Colorado 4.75
Florida 4.71
San Fran 4.71
Houston 4.59
Mil (Actual) 4.57
Pittsburgh 4.57
Washington 4.52
San Diego 4.47
Chicago Cubs 4.06
------------------
4.77
Just 23 extra runs moves them from well below average to a pretty respectable offense. It would have also translated into at least a couple of extra wins, probably putting the Brewers right in the thick of things in the NL Central and the wildcard race.

Coulda, woulda, shoulda. Why did they score less runs than expected? When run estimators miss their mark, it's usually because of atypical production in run producing situations. Let's compare the Brewers’ overall stats with their stats w/RISP:
Brewers, 2006
BA OBP SLG OPS
Overall 0.261 0.330 0.432 0.762
w/RISP 0.262 0.354 0.405 0.759
And the NL as a whole:
NL, 2006
BA OBP SLG OPS
Overall 0.265 0.334 0.425 0.759
w/RISP 0.267 0.355 0.422 0.777
While the Brewers' OBP rises as expected, they lose much more power in those situations than the average NL team does. That lost 27 points of SLG w/RISP is probably the main reason why the Brewers' offense has underperformed in the first half. It will be interesting to revisit this at the end of the season to see if the trend holds up. It might help answer the question of whether this is simply a result of bad luck or a bad team approach at the plate w/RISP.

Series Win Probabilities - MIL @ ARI


Let the second half begin...

Thursday, July 13, 2006

Run Distributions Revisited

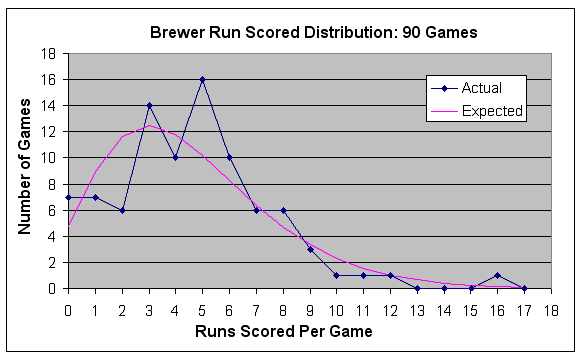
With Melvin talking about the supposed inconsistency of the Brewers' offense, I thought it would be a good time to revisit the run distributions for runs scored and allowed. I followed the same procedure as I did last time, expect I'm now using Tangotiger's nice little program to find the expected run distributions. This allows me to plug in the Brewers' exact RPG for and against.

Let's look at runs scored first:


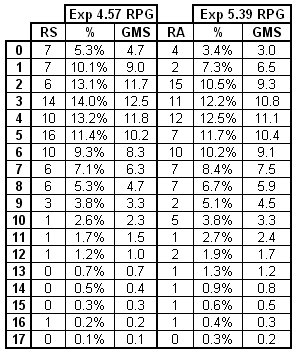
While the Brewers have scored exactly 2 runs in a game less often than expected, they've scored 3 and 5 runs more often than expected. That's generally a good a thing, since they are only going to win a small percentage of games where they score only 2 runs anyway. Overall, it looks like a pretty typical run distribution to me. Unless Melvin's definition of consistency is different than mine, I simply don’t know what he's talking about.

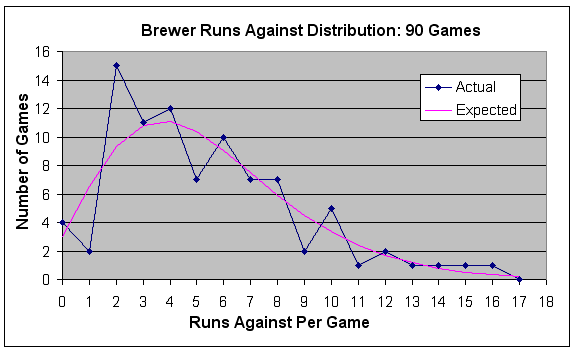
On to runs given up:


What sticks out is how often the pitching staff has only given up 2 runs (15) compared with expected (only about 9). Of course, they've also been blasted for 10 or more runs 12 times, which comes with the territory of averaging 5.4 RPG against I guess.

Here's a summary table:


I'll be looking at expected record based off of different run distributions in the near future. Stay tuned.

Dialed In's Individual Leaders at the All-Star Break - NL

Chris Dial posted the AL midseason leaderboard a couple days ago and now it's the NL's turn:

Individual Leaders at the All-Star Break - National League

Friday, July 07, 2006

Late Season Records vs. Expected

You've heard TV and radio announcers say it a million times:

"The teams that get hot in September are the ones to look out for in the playoffs."

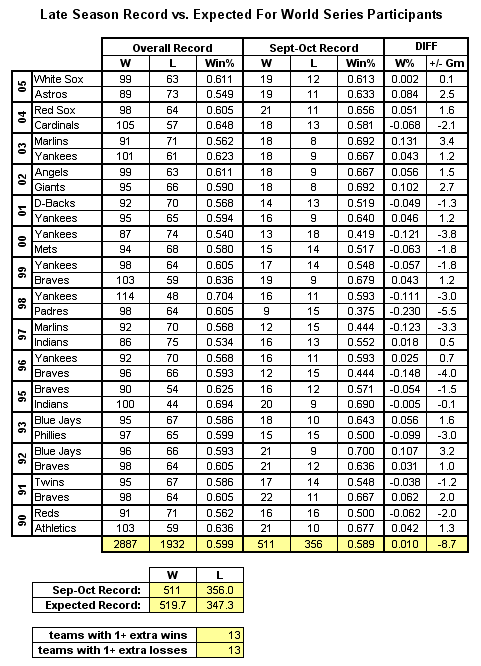
Like many things announcers say, it's important not to simply assume they are correct. For this mini-study, I took a look at the last 15 World Series participants and compared their overall regular season record to their record in September and October. I would expect their late season record to be pretty close to their overall record. Let's see if that's the case:


These teams have actually performed slightly worse than expected, winning about 9 less games than expected in the 867 games they've played in September and October. There's about a 30% chance (rough estimate) of that occurring simply by chance but I wouldn't be surprised if other factors contributed to that. For instance, teams that have already clinched a post season birth might rest much of their talent in the week(s) prior to the playoffs.

Regardless of the reasons, what a team does late in the regular season hasn't appeared to be any more important than any other part of the season, with respect to their chances of getting to the World Series. While this is by no means a comprehensive study, I would be suprised if there's any statistical evidence of teams carrying hot streaks into the playoffs.

Thursday, July 06, 2006

Series Win Probabilities - CHI @ MIL


A 50% chance to finish the first half over .500, despite not having Sheets or Ohka for most of the season? I might have laughed at anyone predicting that before the season started. It's taken a little luck (even the Brewers' BaseRun Pythagorean record is only 40 - 46) but the Brewers are owed a little karma. With Sheets and Ohka both possibly coming back this month and only a very weak NL Central in the way, it could prove to be an interesting couple of months.

Wednesday, July 05, 2006

Replacement Pitcher Summary Update

Why the Brewers' pythagorean record is so bad:


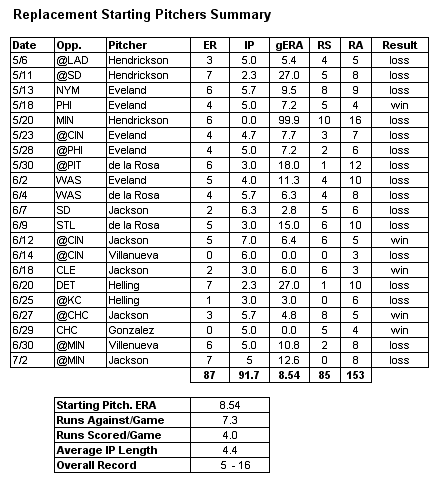
The Brewers have been outscored 85 to 153 in games that have been started by their replacement pitchers (basically, anyone not Davis, Cappy or Bush). Let's compare that to the games started by their #2,#3 and #5 pitchers:
            RS   RA  PythW%
Overall 396 459 .433
#2,3 & 5 311 306 .507
Other 85 153 .255

I think it's fair to assume that Sheets and Ohka starting would have let the Brewers play at least .500 ball in the "other" row.